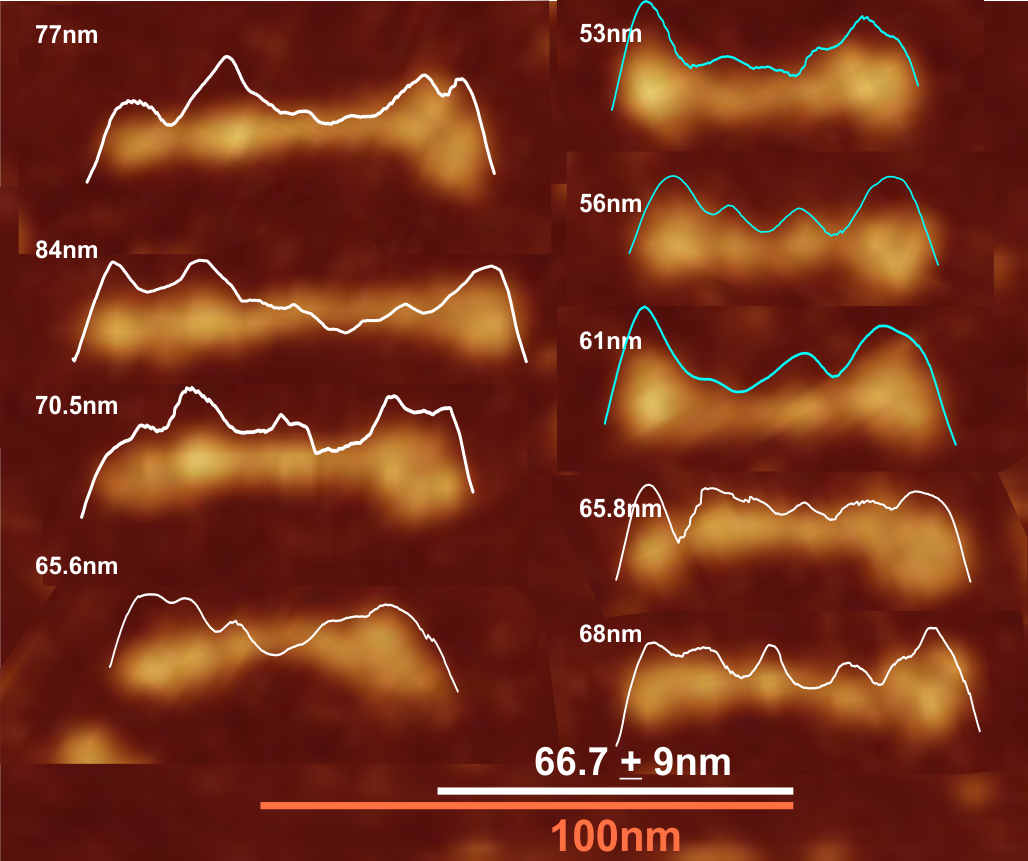
LUT plots for SP-D trimers (n=9) all from same micrograph. There is some difference in my own perception of three top images on right hand said… something missing in the Nterminus region of the images. Finding out the width in nm of the left side (Ntermini) of these images can be done, but where to draw the line for the margin of each peak is a little bit subjective. (Image from Arroyo et al).
This image is the same as previous plot with the top two right plots added. Those LUT plots which show a “togetherness” of Nterminus and first part of collagen like portion are in blue while those plots in white have a distinct peak which corresponds to the first portion of the collagen-like domain.
 From a different photo in this article there are trimers which have been exposed to pH (4.2) and heat (45oC) which still to me have a similar LUT plot pattern (which I will do) to those not heat and pH stressed. There are a couple however which do not show enough definition obtained with AFM (at least in their image (not posted here, but will post) image) in the CRD to distinguish it from the Nterminus.
Seems kind of interesting to speculate that the structure of hexamers of SP-D tend to make “v” shapes where there are two arms on either side of the point of the V…. which would indicate that dependent upon pH the fuzzyball might actually have side to side attachments of the Nterminus, thus corroborating the “empty” dark (low brightness or luminance) of the center of some fuzzball images. (low pH in some disease states)