Beginning with this very old early PTA stained image of collagen, I was wondering whether the analysis by this person (Manley, 1969) would still work well using the methods that i have available to me, that is CorelDRAW and ImageJ.
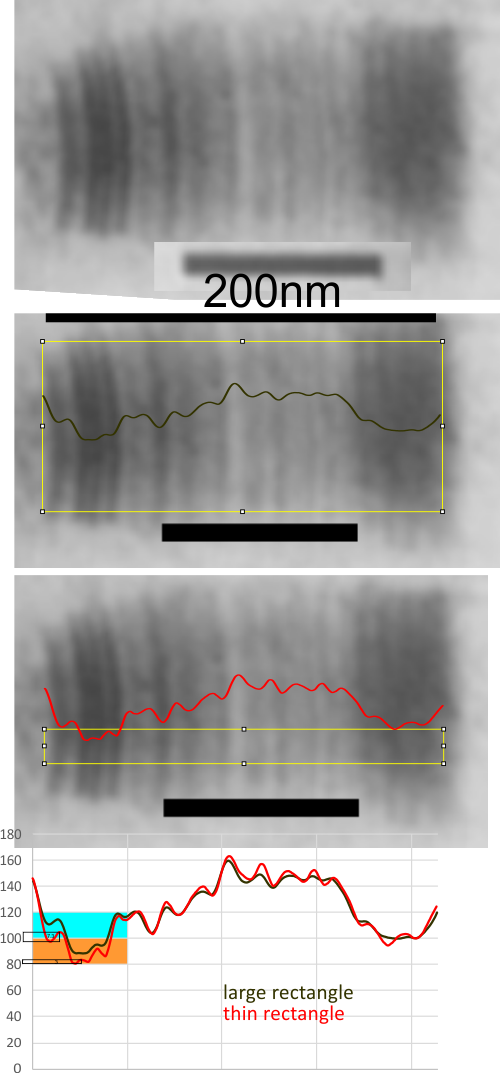
Below is the graph that represents images plotted with large rectangle spanning the height of one of the best stained portions of a micrograph from his publication, using a combination of those two software programs. The tall rectangle and small selected rectangle examine with grayscale LUT plots are virtually identical with the shorter rectangle being a little better and it shows peaks on the plot line that are as fine as 3 grayscale values (1-100 could be restated as 0-255 but is left as 100 here). So the peaks and valleys of almost anything down to one percent change in grayscale is discernable, and can be repeated.
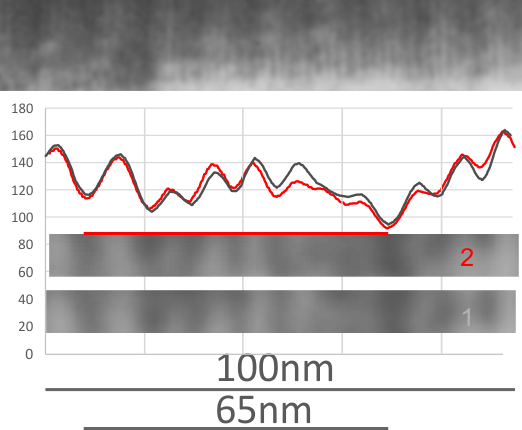
Cropping out two small (same size) areas from the picture at the top of this lower image produced LUT charts also very similar. Bar markers are 65 (Manley said the repeats were between 600A and 700 angstroms I put in a bar marker of 65nm.) The two segments are difficult to equate in terms of grayscale peaks and valleys, though one thing is clear: Even three pixel difference in grayscale will produce a peak.
