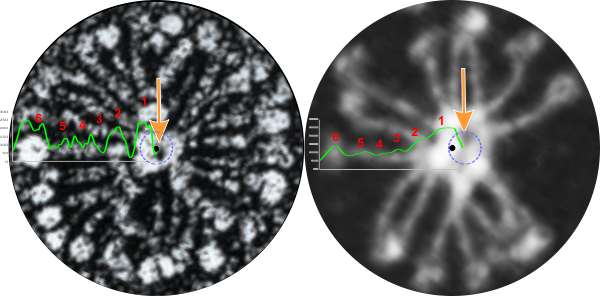
Both methodologies show SP-D dodecamers to have similar LUT plots – and while there are differing numbers of peaks between the N terminus and the CRD, it is more likely that 3 peaks between them is most common. It is a little problematic to use rotary shadowed images to plot LUT peaks because of the background noise from the shadowing process. AFM does not have that problem. However shadowing molecules also depends upon the “peaks and valleys” of the molecules as they lie on the surface so it is not entirely without validity to at least examine the LUT peaks.
Two multimers (one from E. Crouch which reports the image from which i cropped the SP-D multimer is originally from Heuser and the other from Arroyo et al) show multimers with a central low height area. The peaks that radiate out from that central dark area mean to me that the N termini are not bound end to end but maybe side to side (as they are in SP-A, and other “bouquet” arranged collectins. Comments are welcome.
Tiny black dots in the center of each image represent the geometric center, dotted circles are more inline with the dark area which might be a space central to side-to side N termini, the green lines are LUT plots (ImageJ2), red numbers signify the peaks as follows: 1=Nterminus, 2=peak where the glycosylation site which was shown by Arroyo et al, peaks 3, 4, and sometimes 5=as yet unreported peaks which are very consistent in position, width and height, and 6=CRD. Right hand is Arroyo et al’s AFM (with an odd number of arms – 15?) which did have a micron bar marker, and left is Crouch’s image attributed in her paper to J. Heuser (ostensibly 30 arms) which did not have a magnification marker.
