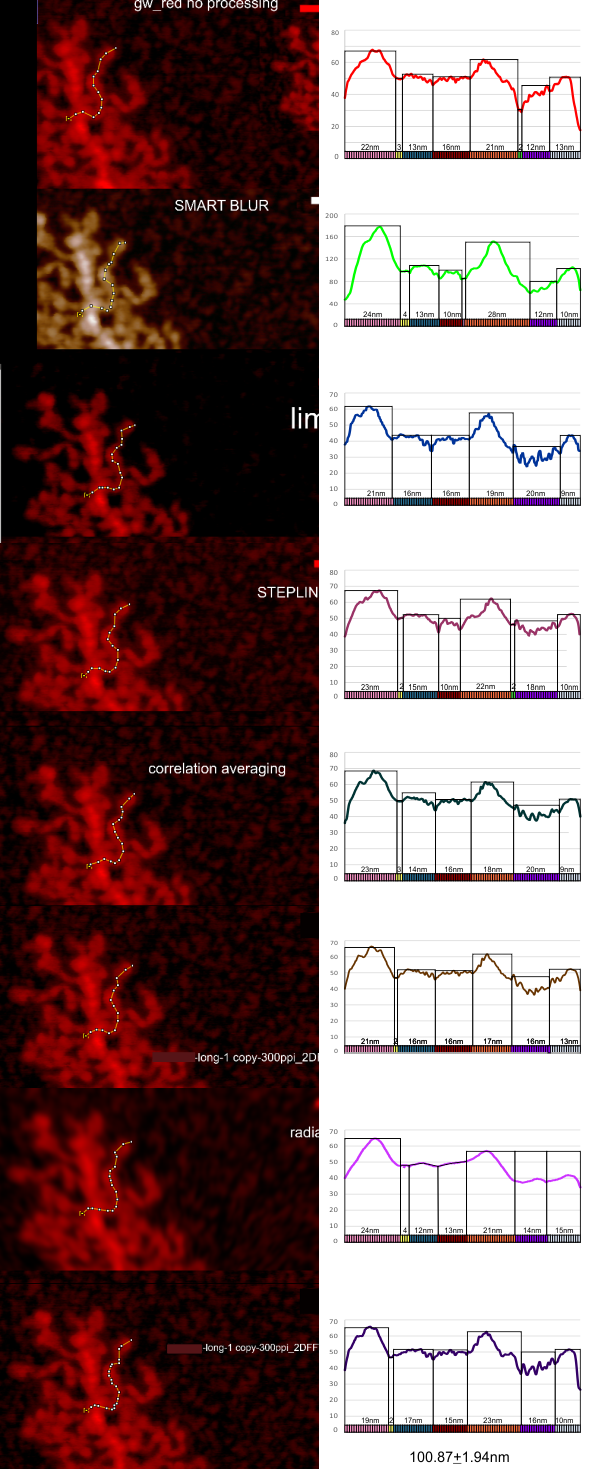
THis is a summary of my own measurements of a really interesting molecule, in which I initially saw (without image processing) a couple of brighter peaks along each arm, the latter radiating either from a ring or a linear multimer. I do think that processing images with different algorithms can help, but certainly one type of processing does not benefit all the nuances of each molecule (in this case each variations in a single arm).
The images below are cut and pasted from whole images of this molecule that were processed in gwyddion (type of processing named in each image) and imageJ used then to create luminance peaks (brightness peaks). You can see that subtle differences in the length that is digitized with a segmented line causes some variation, but processing causes other variations. The bold and easily recognizable peaks persist, regardless of processing.
To date my favorite is just the standard Photoshop “smart blur”. I guess each can choose the plots, for smoothness, or exaggerating peak heights (which one can do with a vector program like CorelDRAW and then adjust the labels. Combinations and permutations are infinite.
The process used here was 1) to convert the images in photoshop (imported as is from the original images from AFM) 2) increase ppi (from 72 to 300ppi) export to tif, open in gwyddion, choose processing menu, save as tif, open in ImageJ, measure barmarker, measure arm (screen print), export plot data to excel, open in excel, plot height, paste (metafile) into Coreldraw, normalize the plots to same height – luminance value, normalize plots to mean arm length (from measurements of the segmented line in imageJ) measure peak widths in CorelDRAW (see colored 1nm bands beneath the 100.87+1.94nm (mean of 1 measurement of the same arm in 8 images, processed with different algorithms).
Processing includes, top, none; second, photoshop smart blur; third, limit range 25-255; 4th image, stepline correction; 5th, correlation averaging; 6th, one pass 2Dfast fourier transform; 7th, radial smoothing; 8th, second pass 2DFFT.
These images are all plotted with the left (beginning) segmented line at a low point to the left of the bright central spine peak and following the course of the arm till the contrast (background luminance) drops off. Peaks were then adjusted to begin at 40% luminance.
COMMENTS:
- three prominent peak widths beginning at the spine: (pink (22.12nm+1.6nm, orange 22.1nm+3.2, and gray 11.12nm+2.1)
- a small flat line just after the first bright peak (yellow (about 2.5nm, present 7/8 plots)
- 2 low level peaks with the following widths: second and third peaks (blue 14.5nm+1.65 and 14nm+2.5)
- prominent (second highest peak)(orange 22.12+3.2)
- Infrequent small flat line between peak 4 and 5 (green)
- low level irregular peaks – (purple) (16nm+3)
- terminal peak, 11.12nm 2.08 (gray)
