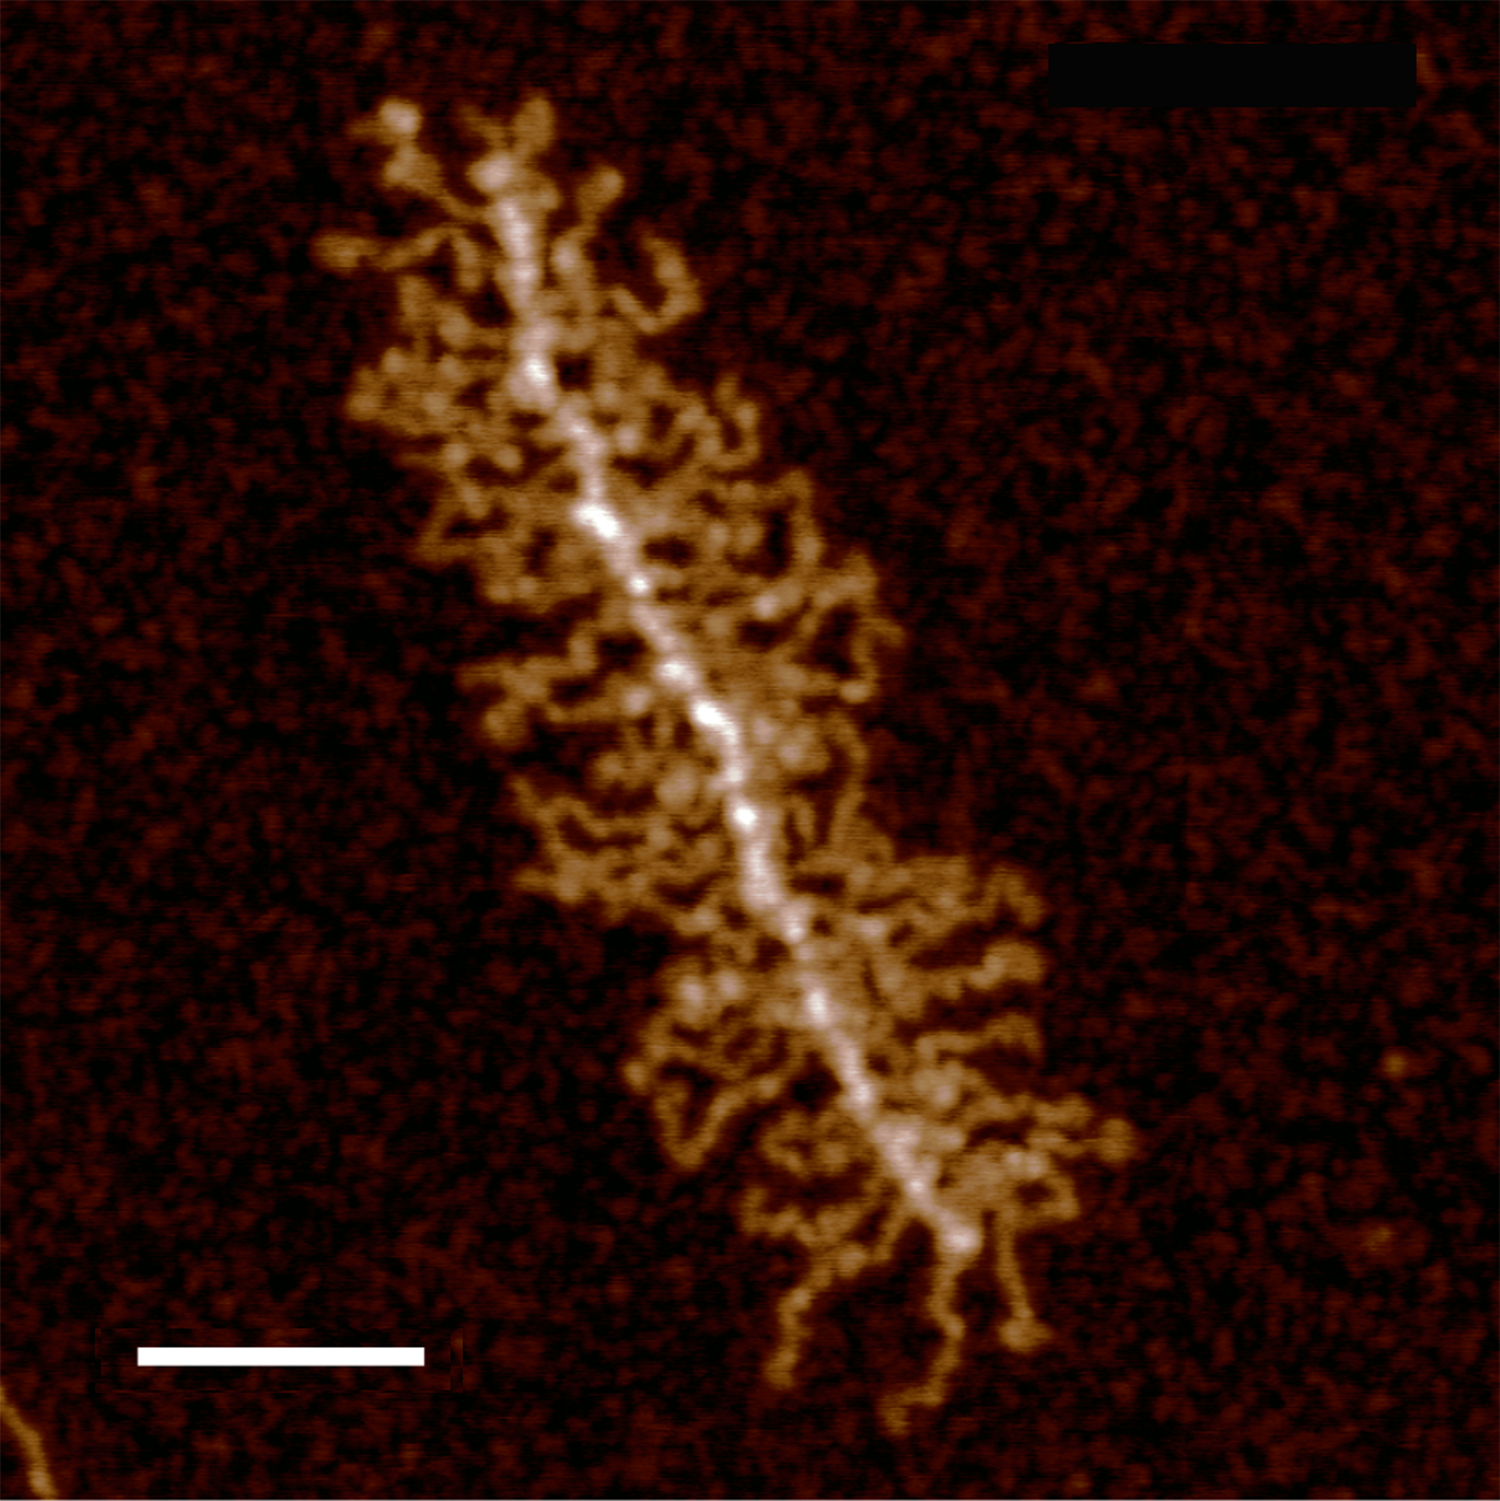
Looking at this interesting multimer (linear molecule here but sometimes it is a ring) I have tried to use Gwyddion to process the image to have a better view of what is happening in terms of height and width along each of the many arms, plotting luminance from a point just before each of the central bright peaks in the spine. There are a lot of interesting ways to enhance, eliminate, adjust, straighten, and transform images in Gwyddion and some are more useful in this particular application than others. At the moment, the smart blur in Photoshop seems to work just as well as any i have found so far. This is the case with the image below which was taken from an ordinary output from an atomic force microscope, then the ppi was enhanced to 300 and size increased to 10 inches. That file shows that the arms of this molecule have peaks, yes, but very prominent constructions typically occurring on either side of the fifth peak when plotted from the center bright spine.
I had noticed the valley and measured it in several other images (processed by 2DFFT, radial softening, range limit, and also with smart blur of 2px in photoshop) so it was evident but not so striking as seen with the 10px radius and 10 threshold (high quality menu selected). So that is a nice tool to have. The constrictions are so easy to see, they are on either side of the rounded bright spots (not the spine bright spots but on either side of the 5th peak along the arms). Bar marker=100nm. “THINK SAUSAGE links” The width of the arms are narrow at the points of the valleys as well.
If i were to compare this multimer with a dodecamer of surfactant protein D i would say the LUT plots going from one CRD to the other in SP-D are bowed, with the highest area under the curve also at the highest central peak (which in the case of SP-D is where the N termini are joined).
