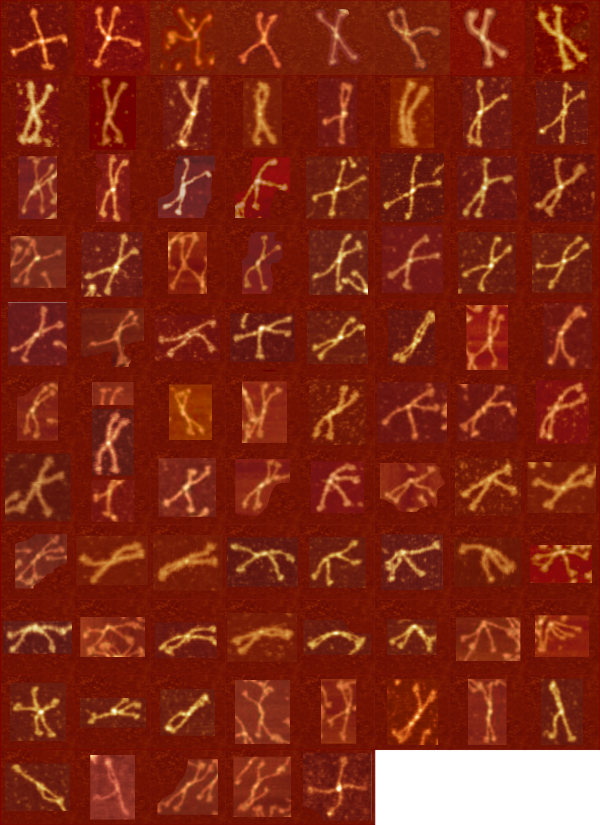
All images from two papers by Arroyo et al (2018 and 2020). These are among the images that have planted the idea in my mind’s eye that there are very discrete and nicely spaced and sized peaks between the N termini joining and the CRD. There is often a glycosylation peak (described by Arroyo) but it is not consistently found on all arms, that provides a huge burden of proof of the number of peaks along the collagen like domain (which is where I first became interested in this domain….as it has been slow in being modeled on the protein database websites). I can use this summary set to approximate what percentage of the arms (trimers) that have a peak sufficiently high (on a scale either of 0-255 or 1-100) to be called glycosylated. It might help determine how many peaks are along the collagen like segment if a quantifiable height is found (or not found) for those glycosylation sites.
The following set of 80+ images all come from different figures. Please note that sometimes error bars in the figures are off, sometimes the measurement of error bars by me is off and this all translates into a need for a solid consensus measurement of dodecamer arm (hexamer) width.
I have done my best to size all images using available bar markers. And also helps figure out whether the N termini are joined end to end or side to side (the latter being my personal preference based on the width of the center N termini composite peaks. (again, I acknowledge Arroyo et al for these images with which I have worked)