thank you science

wonders of everyday science

Menu

Skip to content
  • About Us

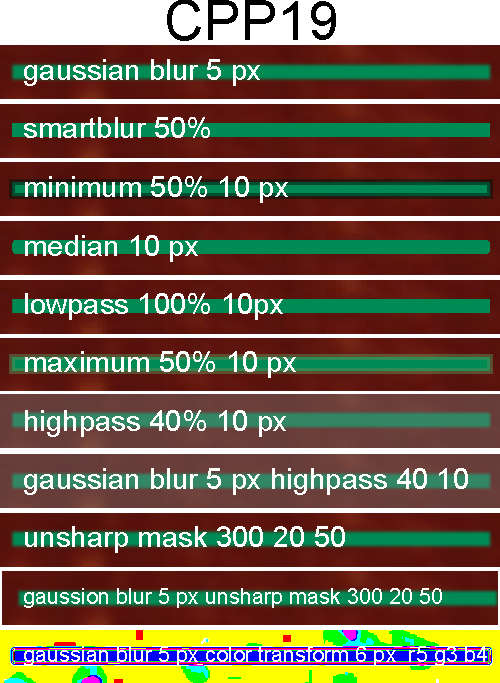
Image processing: just the “bar”

August 1, 2021Methods to assess TEM and AFM imagesthankusc


-content/uploads/2021/08/processing_line_summary_crd19.png” alt=”” width=”500″ height=”508″ />


Post navigation

← Measuring SP-D using the “diameter” function in ImageJ Comparing gaussian blur – 5 and 10px radius →
May 2022
M T W T F S S
 1
2345678
9101112131415
16171819202122
23242526272829
3031  
« Apr    

Categories

Recent Posts

  • Ridge plot: a single surfactant protein D dodecamer – many image processing programs
  • Your Smile
  • N termini junction peak width in nm for one surfactant protein D dodecamer, tiny peaks at valley beside it
  • Amerithon challenge: finished
  • N termini peak of a single dodecamer of surfactant protein D

Archives

Categories

IMAGES

SEARCH

Proudly powered by WordPress