
Octave P=autofindpeaksplot(x,y,0.00039524,74.8105,17,17,3);(Thomas O’Haver).
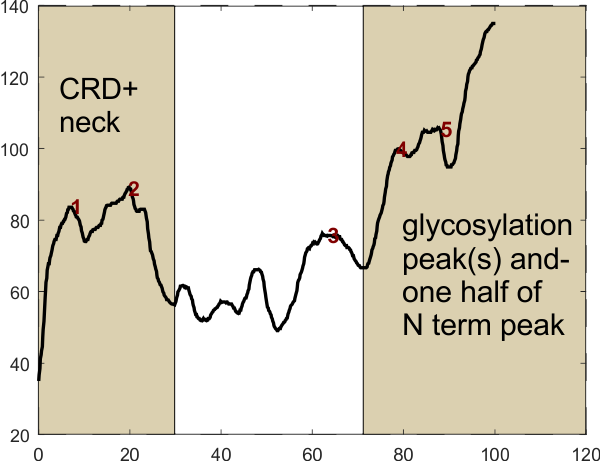
Peaks labeled 1 and 2 above are part of the carbohydrate recognition domain and neck domain. Peaks in the light central rectangle (including peak 3) are four presumed-predictable peaks in the collagen like domain. Peaks 4 and 5 represent the glycosylation site and the last and tallest peak on the right is “half” of the N termini junction peak. This plot represents just one trimer of a SP-D dodecamer. Xaxis is normalized to 100pc, actual length of a trimer is around 135nm. (NB, this plot and peak detection does NOT show the tiny peaks beside the N term, one each trimer which I do believe is important).
In the above image (number 97), the yellow tracing line on the image (and thus the beginning of the plot (left hand side of the plot, labeled CRD and neck) begins at the bottom and terminates in the N term.
Abbreviations: CRD, carbohydrate recognition domain; SP-D, surfactant protein D; neck; coiled coil domain just beside the carbohydrate recognition domain; LUT, look up tables, the name for brightness plots in ImageJ.
New approach to finding number of peaks along the trimeric arm of SP-D could involve just counting those peaks that are between the alleged glycosylation site and up to the neck and CRD. After having looked at this molecule for three years to try to figure it out i thought today that one possible reason for variability in the number of peaks in a trimer (LUT plots from CRD to the center of the N termini junction ) is not variability in that collagen like region but actually is attributable to variations in the number of peaks in the CRD itself, and the glycosylation (peak group). The reasoning is that when I look at the AFM image (processed by dozens of different filters and masks and by many different programs, i can actually see the glycosylation peak variability, and the CRD variability…. even to the point of seeing each of the three lumpy CRD bending and squeezing each other at the end of a trimer. I can also see a rotational lumpiness to the alleged glycosylation site which likely represents one, two, or three carbohydrates attached to the one, two or three molecules of the SP-D trimer. The three large and predictable lumps at the CRD are well known, but whether there is a lumpiness to the peak at the alleged glycosylation peak has to my knowledge not been described before, but in the numerous plots of trimers, it becomes evident that it may exist, and relevant to that point is the variable absence of the glycosylation peak (not complete absence) in un-glycosylated SP-D reported in Arroyo’s paper.
Therefore — the most meaningful peak analysis would take into account the variable peaks in the CRD and in the alleged glycosylation area… and focus just on counting peaks in the area of that trimer beginning at the valleys on left and right sides of those two areas.
A little bit of a snag is the gradual slope (up to… depending upon whether the plot begins at N, or CRD (LOL) from what i suspect is the neck.
Figures above: (1) is the processed image and ImageJ plot and it is especially easy to see that the CRD and the alleged glycosylation peak have their “own” smaller peaks; (2) is this same image which has been signal processed in Octave with a finding peaks plot program (link above and the peak finding parameters). To the resulting signal processed plot I added vertical boxes to the valley after the presumed CRD peak on the left, and before the alleged glycosylation peak on the right which includes the upslope of “half” of the N termini peak. This segmentation box in the center has just the right amount of peaks that I have perceived, in my mind, after lots of “looking” along the collagen like domain of dozens and dozens of images. This is obviously just one plot of one trimer here…. but it is certainly representative… i will continue collecting plots to verify.