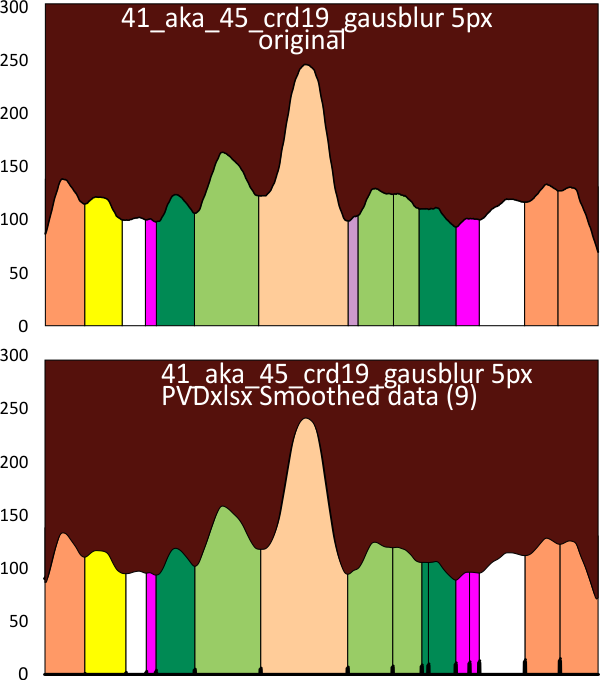
Comparing peak height and peak width for a single hexamer of surfactant protein D has lead me to the conclusion that:
1. many methods (image and signal processing) can be used that produce very similar results
2. many methods (image and signal processing) can produce rediculous results
3. concensus may or not provide the best results
I have examined this particular AFM image of SP-D (which i call 41_aka_45 (an image of am SP-D dodecamer from a publication by Arryoy et al) — the name is given here so it is possible to relate this post with many previous posts on this image)for hours, literally, using more than half a dozen image processing programs and dozens of image processing filters, as well as signal processing using two excel templates for finding plot peaks (by Tom O’Haver) and peak finding functions which use Octave. The purpose is to find the best (and easiest) method(s) for determining peak number, peak width, peak heights of grayscale plots (made using ImageJ) of this type of image and similar images. I was really pleasantly surprised when Aaron Miller added a function in one of the excel templates that displayed the valley points in the excel plot. This provided a second plot which, when exported as a metafile, could be used to quickly define peak widths as vertical lines. While not using peak slope to calculate peak width in a more sophisticated way, it does allow for easy comparison of peak number, width and height obtained as signal processing, with those parameters obtained with image processing and plotting in ImageJ.
Below are two plots, top identifies peak valleys (peak width) and height (on an image that had been filtered with a 5px gaussian blur, but no signal processing), and the lower plot was defined using signal processing on the same image, in this case the PeakAndValleyTemplate for excel (by Tom O’haver) with a smoothing factor of 11 or 9 – i need to check.
crd= corelDRAW 19; gausblur 5px-gaussian blur 5px; PVDxlsx (PVDxlsx=PeakAndValleyTemplate for excel); (compare colors and widths in the two plots: dark orange outer peaks=CRD, yellow= possible neck domain, white, pink and darker green represent as yet undefined domains likely in the collagen-like dolmain, the light green the named glycosylation site (glycosylation appears to cause a lumpiness (perhaps relating to glycosylation of 1 – 3 molecules in the trimer) a small peak (purple) just before the N termini junction(light peach color), with the latter often divided at the center with a valley).
