All posts by thankusc

Peak counts of a single surfactant protein D molecule (an AFM image): Peaks counted in trimers

Peak counts of a single surfactant protein D molecule (an AFM image of a dodecamer): Peaks counted in trimers – all processing methods are summarized here.  The mean peaks per trimer can be an odd interger depending upon whether the N termini peak is actually one peak, or two, in which case the number of peaks per trimer must be an even number. Both variations occur, and it begs the question of how the four trimers are linked in the middle (ie the 12 monomers at the N termini junction)… some say it varies, and i think i would have to agree.

Variation would be a partial explanation for differences in the center area of the N term peak group in terms of small peaks at the very high point of the N term.

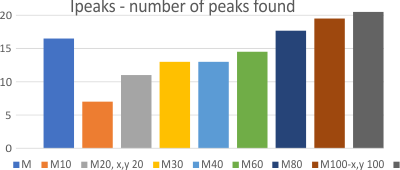
That is a separate topic, this is just total number of peaks per trimer. I used the same molecules, and color scheme, and dataset that has been used in previous posts concerning peaks, per surfactant protein D molecule (trimers, hexamers and dodecamers). Programs used for image processing are listed on the left. Signal processing can be found in previous posts, and i also included the citizen scientist peak counts.


The difference in positioning, and stretching molecules (right and left, or top and bottom) makes a difference in how many peaks are found. This generally is completely known to the observer, the differences in trimer length can be easily seen (as stretching, folding, or compression) and documented. In this particular case the left half of the dodecamer image  (arms 1a and 2a, have fewer peaks counted by all peak counting methods) and the right hand side of the dodecamer  has more (please look up this link to see the image) (and when i calculate the nm length it will be obvious there too). There are a couple comments on why this happens,

1) is that the extra spread shows the lumpy nature of the glycosylation peak and the adjacent slightly smaller peak.

2) the CRD and neck peaks tend to be exaggerated because of the many ways that part of the molecule can fall onto the mica, and

3) the N termini junction of the dodecamer often then shows a peak right at the high point of that N term peak and the

4) tiny peak in the valley either side of the N termini peak, is often overlooked because of the overwhelming width and height of the N termini peak.  Aside from being concealed by the brightness (high gray scale value) of the N term peak, signal processing is very inefficient in detecting tiny peaks when either side has large peaks.  So machine learning may be the only way that this tiny peak can be varified.  Peak value for the right hand arms of the dodecamer is almost 9, while the left hand is just over 7.

Peak counts of a single surfactant protein D molecule (an AFM image): Citizen scientist counts

This quick look at what the perception of peaks might be in unbiased individuals was an interesting side-trip. Two instances of KNOWN bias on the plots accounted for the smallest peak count and the largest peak count. Haha… I did not expect that.  I represent a reasonable biased count.

I have counted peaks on this same image hundreds of times (actually 274 times – one or two times with the mode of signal and image processing (not every single time, but obviously many many times) which means i counted the original images (pixelated and rough, to the most processed, gaussian blur and limitrange, and the counts with some programs which added rediculous numbers of variations (one example would be “roughen-inside” using Inkscape) and others that eliminated some detail. My peak counts from the exact two plots given to the citizen scientists differ considerably from theirs. I counted the gaussian blur 10px and limitrange 100-255 image as separate peak counts before, and at the same time as that the image was being used by another imaging or signal processing program for peak counts. The mean and standard deviation of my counts are variations in my own observations, which over two years have changed.

My variously obtained peak counts: 1) from images only, 2) from counting plots from image and signal processing programs 3) from graphing out the peak widths from plots obtained from processing.

Peak counts of a single surfactant protein D molecule (an AFM image): signal processing programs: scipy.signal

I used a lot of settings with this scipy app (scipy signal find peaks)(made for me by Daniel Miller from online resources and libraries) which allowed settings of “prominence” “distance”  “width”   “threshold”  and “height”.  See below. The image of a surfactant protein D dodecamer has been in this blog dozens of times. I used (image processing = either a 5 or 10 px gaussian blur, and on half the images i used an additional filter –  limitrange (100-255)- using Gwyddion. Image processing was applied before signal processing (gaussian blur of 5 px or 10 px, and limitrange. The image processing programs are listed below. The whole dataset comprised 10 dodecamers (thus 20 hexameric arms).


sci/py-P0.2D30W10T0H0
sci/py-P0.2D30W5T0H0
sci/py-P0.3D15W7T0H0
sci/py-P0.5D15W10T0H0
sci/py-P0.5D15W5T0H0

Peak counts of a single surfactant protein D molecule (an AFM image): signal processing programs: Octave – AutoFindPeaksPlot

All settings that I used in Octave, AutoFindPeaksPlot were lower than those which I thought should be counted.  Below see my counts of the plots generated by Octave while counting peaks, and the results of counting peaks using various settings in AutoFindPeaksPlot.m (see table, at bottom) You can see from my counts of peaks present on the output plots that accompanied the other values (peak height, width), that the autofindpeaks values (at least the default values, and a few that I typed in) are much less lenient.  I found Ipeaks.m was closer to what I liked, and likely Autofindpeaksplot.m wont be used on the other 100+ images.

octave-AFPP-xy0.000108,32.71,32,32,3
octave-AFPP-xy0.000108,8.43,32,32,3
octave-AFPP-xy0.000129,28.99,29,29,3
octave-AFPP-xy0.000129,8.5,29,29,3
octave-AFPP-xy0000066,24.8,41,41,3
octave-AFPP-xy0000085-24.5867-36-36-3
octave-AFPP(x,y)


Peak counts of a single surfactant protein D molecule (an AFM image): signal processing programs: PeakDetectionTemplate xlsx

This excel peak finding template (Thomas O’Haver) was easy to use to find peaks, though I personally found that peaks that I deemed to be background were typically found, while one tiny peak that I find in many images was constantly overlooked.

My counts from both the image, and the individual plots in ImageJ were about 15 peaks per hexamer, where here it was 19.25 +/- 0.82.  The N is small but there was not much variation when i used different settings. Only one image was processed, using 0.6 as the amplitude threshold and either a slope threshold of 0 or 1 (thus four hexamer (arms, CRD to CRD with N peak in the center) were measured. The PeakValleyDetectionTemplate, using this same image processing combination, that is, gaussian blur and limitrange 100-255 in Gwyddion, also produced a large number of peaks (see previous post).

The more appropriate setting for the PeakValleyDetectionTemplate was used on a single image of 41_aka_45, and that was AmplitudeThreshold 0.6, SlopeThreshold 2.5

I have more peakfinding results using other SP-D dodecamers, but just one of the dodecamer I have called 41_aka_45.

Peak counts of a single surfactant protein D molecule (an AFM image): signal processing programs: PeakValleyDetectionTemplate-xlsx

Peak counts of a single surfactant protein D molecule (an AFM image): signal processing programs: PeakValleyDetectionTemplate-xlsx uses a program by Thomas O’Haver. I found that the best results for the plots of surfactant protein D were found using a smooth level of 11.  In the results below, 10 of the 12 image processing programs that I have used to determine the number of peaks along a segmented line drawn through the center of surfactant protein D (hexamer) arms were “peak counted” with this excel program.  The peaks counted at the value of smooth 11 was in line with counts made directly from the images, and with other signal processing programs.  This peak counting program was the easiest (in my opinion) to use and it exported a plot with valleys marked making it very easy to come up with a graphic identifying the position (width and height) of peaks.


Sample plot above, peak count from ImageJ plot and peak count using PeakValleyDetectionTemplate.xlsx smooth 11.

Below, examples of smooth 5,7,9,11 and 15.  Smooth 11 varations and combinations of the image processing plots were used.

Peak counts of a single surfactant protein D molecule (an AFM image): signal processing programs: Lag Threshold Influence

Peak counts of a single surfactant protein D molecule (an AFM image): signal processing programs: Lag Threshold Influence were measures put into a “batchprocess” app by Aaron Miller which allows selection of different parameters for LTI, and processing on many excel files at once.  The parameters of Lag Threshold and Influence were adjusted, and peaks found in the images (same ones used for finding peaks in other signal processing programs, also listed in a previous post).  This program normalizes x and y and esports those excel files to a new folder using the L T I settings chosen. I ran peak finding on many molecules other than this particular one, where there are only a few samples.  Charts below.  L T and I change peaks counted, and like Octave Ipeaks function, one can choose the input statements to create a count you like.  This is not exactly what I wanted to see with signal processing, but it is what I have come to understand, is what i get. It comes back to using common sense with the image, and then using the programs for automation.

Peak counts of a single surfactant protein D molecule (an AFM image): signal processing programs: Octave, Ipeak

Over 14 peaks, and a mode of 15 peaks was found as the mean of peak counts of a single surfactant protein D molecule (an AFM image) using five programs, and within each, a variety of peak finding settings. Each of these programs defines how they detect peaks in different ways (which makes it a little difficult (for a non programmer like me) to compare them. Nevertheless, the number of peaks seems to be very close to what is found by application of conventional image processing filters and masks.

A list of the image processing programs used before signal processing is provided on the left, the types of image processing is give above that list. (two programs were not used, inkscape and Octave, the former because it did not have the conventional filter names and applications as other programs, and Octave because this program was very cumbersome compared to dedicated image processing programs.  Again, the mean number of peaks is very close to that found with image processing alone.

Counts of peaks with signal processing algorithms do NOT include counts from the image directly, or the original plots created in ImageJ, unlike the values found in the mean number of peaks using image processing. The list of full names of the image and signal processing programs has been in previous posts.

Two image processing programs (cpp19 and gwyddion) were used with Octave as a signal processing program to detect peaks. Images were subjected to either a 5 px or 10 px blur, and then using gwyddion, some were subjected to a limitrange filter (100-255). Various settings were used in Octave Ipeaks.  Except for the limitrange (most right set of numbers) more peaks were detected by Octave than by peak counts by hand from images, or plots.Number of peaks found was easily shown to increase when the suggest peak number was increased.

Ipeaks input statements and results were grouped as above (and individually, below).

Verge of a Dream: Gray

Whatever color it is
A hovering gray
Of a sky, of a day
There is feeling of
a careful distance
From the several
window panes
To stay.
With the glass
misinforming
as an empty
sunroom will.
Whatever color it is.
A tear stain gray
in years so still the
drawn in cell walls
become by
discouraged dreams
of home.
Whatever color it is.
An age made gray
why ask
when it became
white… perhaps made
In the small agony
of surprises
each time
in the
image the
mirror provides.
Though not in lying,
It will not make
plain the next
time is not the
last time.
The finger snap
of one time
already passed.

RLB 04/28/2022

Verge of a Dream: glass shade

I saw you in the semi-darkness
stepping on the work bench
foot rest
one dark heel below the other
and the glass shade held
by the hand that created it.
Bound and belonging on
a foundaried base.
The art in reverse
On the glass, maybe cosmos
Dangling
Or thick dahlia….
The light was less so,
the Jerusalem lily unbrightened,
As though through
settled fogginess
silently asking it be
brought to me
brought to me
and no other.

RLB 04/27/2022