just this micrograph (link and authors on previous post) seems to have about 17 arms per multimer. This is not an even number — however only 2 of the 13 used in the sum and SD were odd numbers so most are seen as even numbered-arms multimers. Partial images not included. n=13, 17+0.3. This really just confirms previous posts.
Category Archives: Ultimate order, the cell
SP-D multimers:
recombinant SP-D (Met11ThrT/C and Ala160ThrG/A) is what I take it that Hartshorn et al used for this AFM micrograph. I have used their micron and light markers to make some observations on size of the fuzzyballs (SP-D multimers) and give the measures below. 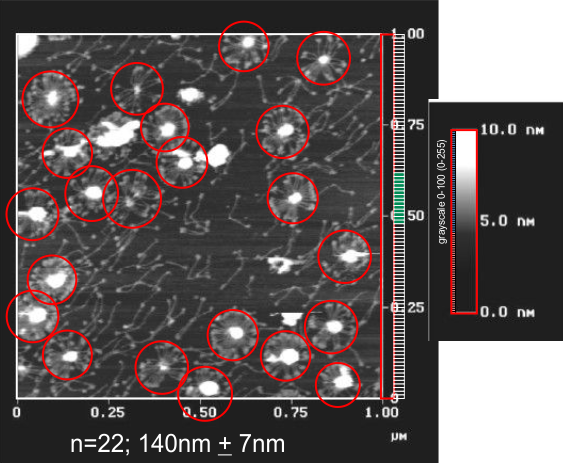
What do those bends do?
SP-A exists (according to some published papers) in open and closed configuration…bending i guess only at the N termini juncture, and then again perhaps bending at the CRD and the neck. SP-D in fuzzyball multimers seems to be flexible at the N termini junctures as well, but I have no seen much text about the side to side N terminus connections in SP-D, which in my opinion likely exist similar to SP-A and some other “tulip type configuration” c-type lectin multimers.
Looking only at the “arms” where the collagen-like domains are doesn’t offer much suggestion that there are kinks in SP-D, but does suggest kinks in SP-A (also published data by others).
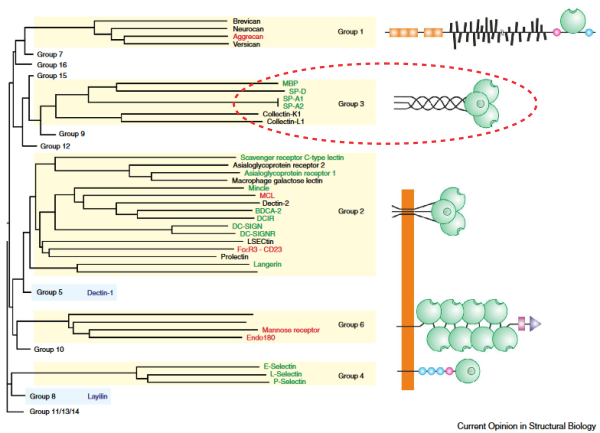
Here is a nice image (i added the circle over systems aligned with SP-D structure are) which is from a phylo tree from an article by Drickamer and Taylor which shows the collagen-like domain as a more or less straight portion of the 4 part trimer as an example, but without any reference to bumps or bends or lumps and also without any diagramatic representation of the coiled coil neck. Nonetheless it gives a view of the repeated elements in those 6 c-type lectins – which they assign to Group 9 – and i dont know what that signifies yet).
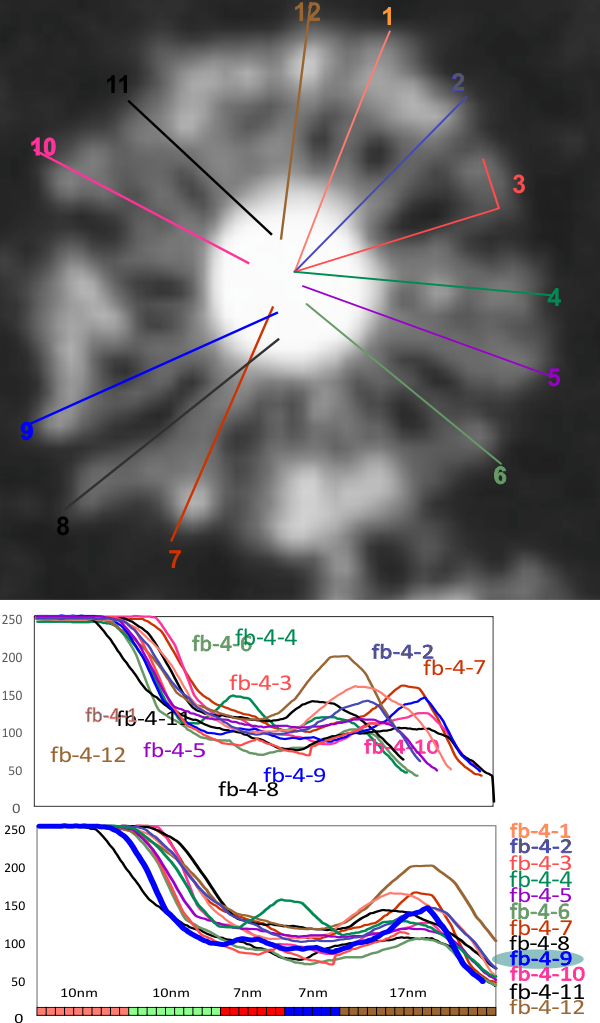
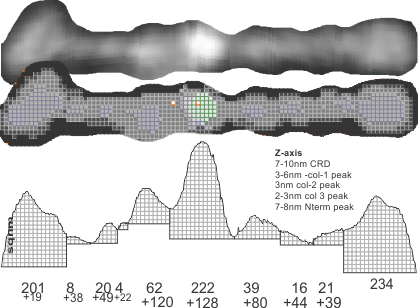
Individual LUT plots on 12 of the arms of an 18-mer (i think) SP-D multimer
I have shown two LUT plots of straight lines in the arms of 12 of the “likely” 18 arms of this SP-D multimer (would that I had access to better images… but I am having a difficult time finding original images or receiving donations for me to analyze. However, these plots (original in terms of length for the top graph and rendered to 50 nm for the bottom graph then divided according to nm does show pretty much the same distribution for the LUT peaks as the dodecamers (i chose the blue plot (arm 9 of this dodecamer (you can see which one is arm 9 in the black and white AFM at the top) as it showed the small peaks in the collagen-like region and what is typical of multimers, a totally blended very white (grayscale at 100% or 255 which ever way you plot the grays — left most peak (that ends in the center (per the lines drawn on the fuzzyball)). The width of the CRD stays pretty close to the dodecamer values (right-most peak on two bottom graphs). Considering how fuzzy the original AFM image was/is, these plots remain consistent with the 5 peak per arm motif for SP-D arms.
A quick SP-D multimer sketch to explain the dark “hole” in the center
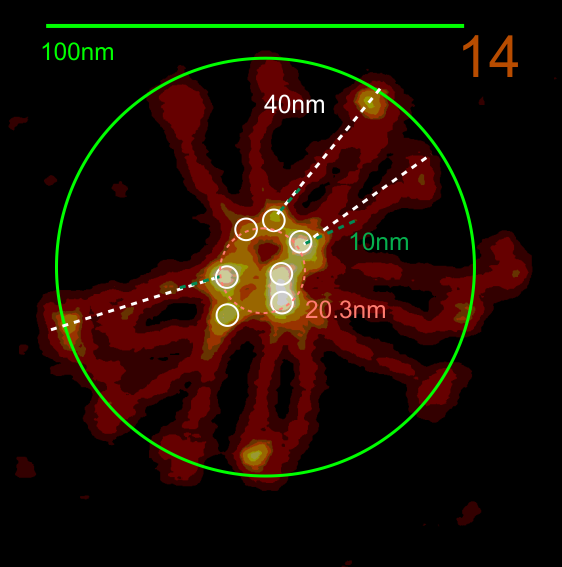
For about two years I have pondered over why in some of the SP-D multimers there is a low grayscale area in the center, in some cases looking almost like a star shape, and certainly related to how many arms are in the multimer. Below is visual trip through image processing a single multimer with 14 individual arms.
Three images also image processed but two diagrams hand drawn of a 12-armed multimer. I will try to figure out a way to verify what I have thought about for all this time…that is, a hollow core SP-D fuzzyball. I don’t see any other way….but the catch 22 is that the shadowed images dont really fit this idea.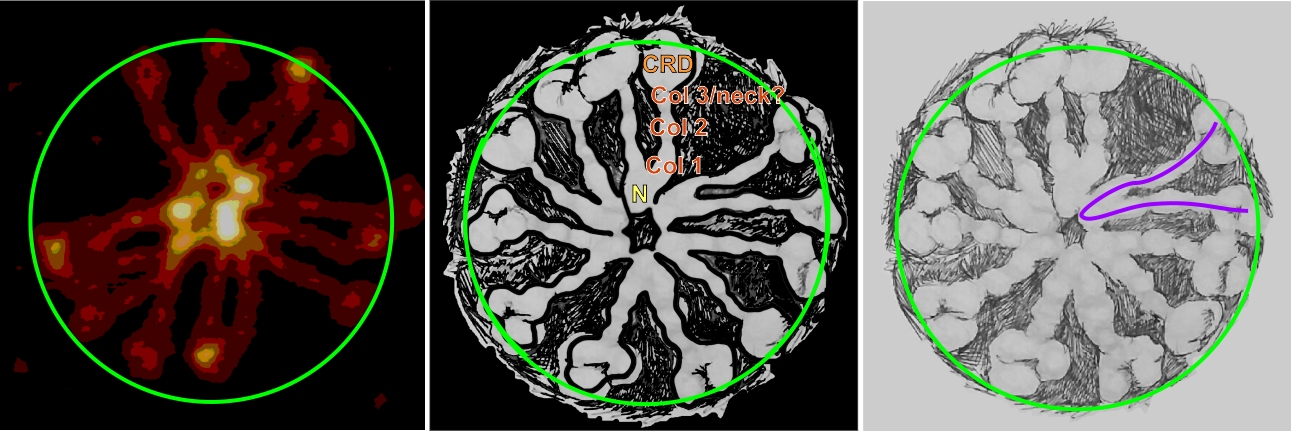
Center of SP-D multimer
The N termini of a multimer of SP-D still seems to me to be a “ring” rather than a center bundle. The ring in the case of this image (not mine) measures about 20 nm in diameter and each of the arms about 40 nm. These measurements are relative to concensus measurements on SP-D (typically the dodecamers) and I am not at all convinced that most individuals use correct micron bar markers. In fact, in images where fuzzyballs (SP-D multimers) appear along side of dodecamers, I wager that they are slightly more compact, per this image from Hartshorn et al (Respiratory Research, 2008) keeping in mind that this particular SP-D is a mutant which they label as Met11, Ala160, their bar markers and image below. Diameter of a dodecamer is actually 130 nm according to their measure (which is in orange, at 100 nm). There is no center gap in this particular multimer, however there are also many many arms and the center ring might actually be shown here dimensionally covering what would be a center dark area as seen in multimers with fewer arms. 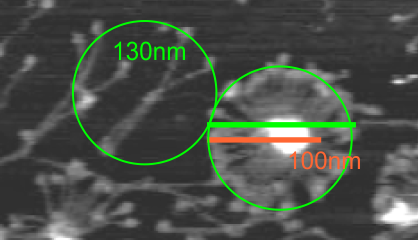
Here is another AFM (not my image) which shows the center ring to be about 20nm in diameter, and each of the arms of this multimer (three measured here) measure at about 40nm. The main peak lateral (circumferential) to the Nterminus peak in dodecamers which lies in the collagen domain, is about 11nm in width, (as seen on many previous posts for dodecamers, on this blog about SP-D) and is also measures about that in this image… in terms of distance to the peak of the Nterminus. I take this to mean that the center of the multimer is NOT at the center of the whole molecule… because it is just NOT a peak, but a valley, but instead at the center of each of the bright dots (in this case 7 bright spots in a ring of this SP-D multimer of 14 arms).
Not so clever an approach, but a pretty picture of SP-D
Just cannot figure out how best to narrow down the dimensions of these images. But this one is kind of interesting, and the grid (at nm2) makes a nice place for conversion to 4 or 5 levels of grayscale, and provides a measure of x,y and z in sqnm.
LUT (grayscale) 3D plot of SP-D (two arms of a dodecamer) Peaks – not valleys
I manually changed the values from 0-255 on each of the pixel determinations that I retrieved from photoshop (previous post) to make these peaks not valleys.
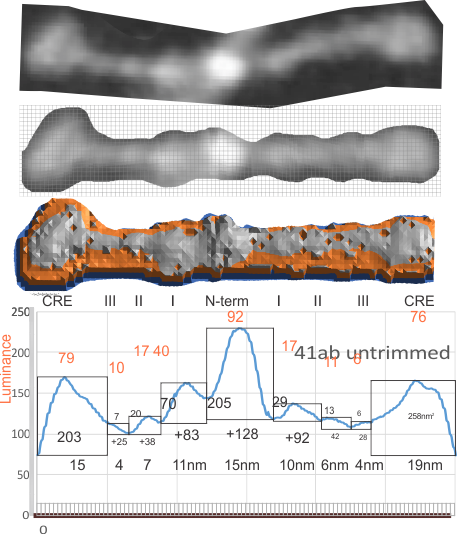
Original AFM image (one of the two double arms of a dodecamer – CRDs on each end N terminus in middle) on top, sliced and diced and straightened and exported image for Photoshop and pixel determination (which determines – more or less_ the width of the various regions of the SP-D arms, and 3D plot then in excel. and plot from ImageJ, and measurements in NM and grayscale (labeled here luminance – which it probably should not be called).
LUT (grayscale) 3D plot of SP-D (two arms of a dodecamer)
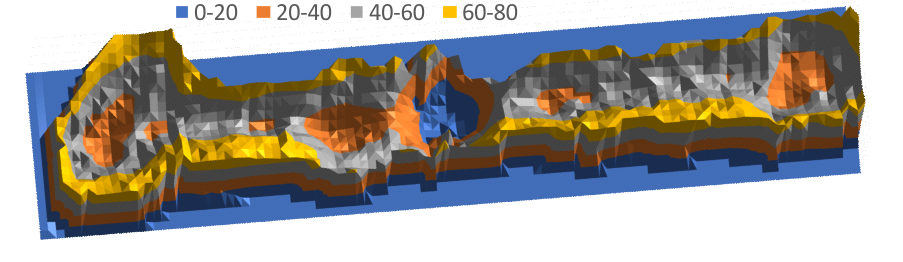 easy to see the CRD, the N terminus where two trimers join in the center (looks like a blue lake) (peaks are “valleys” here so I need to do something about that). The peaks at the junction of the collagen-like domains and the N termini are the next highest (lowest here) peaks (orange).
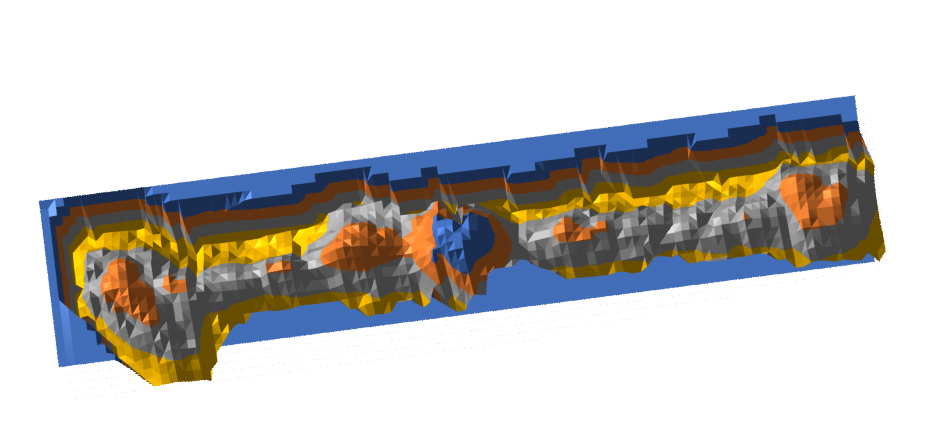
Simpleton inversion (shadows are important in graphics) makes these peaks.
Half an arm of SP-D dodecamer 3D LUT plot
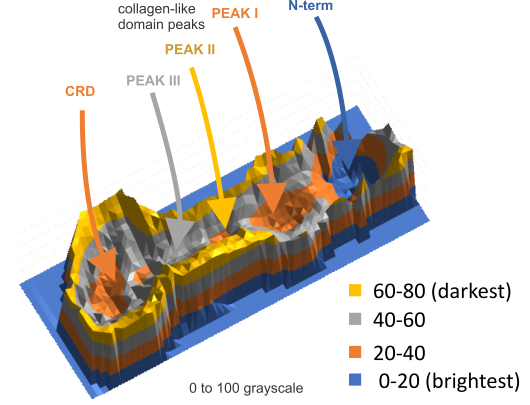 Having fun with this. It does show the width of the AFM micrographs better than taking just a single line or a thin rectangular plot of a straightened SP-D dodecamer arm. I like the way the obvious thinning of the height measures work over the collagen like domain peaks, as well as the spread of the trimers where the CRD sort of fan out. The collagen-like-domain (labeled peak I is not only the tallest of those three peaks, but the broadest as well and may include part of the coiled coil neck? Any comments are welcome. The N terminus peak is on the right hand side, and has a value very close to 100% in this grayscale plot (using photoshop picker tool at 1 nm2 intervals (thousands of them) and excel to plot the image. It should be reversed (100 – 0) to make the image inverted. This goes further than the blog yesterday which was just really the CRD.