Category Archives: Desmosomes – comparisons

Annulus around desmosome – freeze fracture

Here is an image from a letter to the editor (which i didn’t read thoroughly but was just looking closely at the freeze fracture of tight junction encircling a desmosome) and saw what I had seen in the transmission micrographs of thin sections: that is…. a small ring around the desmosome which i called the annulus which is restrictive and different than the intercellular space nearby.   This particular freeze fracture micrograph (original found here)  by Yasuo Kitajima shows it clearly, yet is it not marked. I don’t know what the function is but clearly a “no fly zone” surrounds the desmosome. Top micrograph untouched, bottom micrograph with bar marker and blue dotted lines showing part of the annulus. It is kind of nice that this particular desmosome is approximately what the literature suggests in terms of number of nm for the diameter.


so, next question is what are the semiregularly raised areas…?


7, 11, 21

I know his is a silly post…. but i bet that actin filaments (generally regarded to be about 7nm in diameter), and intermediate filaments (generally regarded to be about 10nm) and microtubules (generally regarded as something between 20-24nm) really are really a set of prime numbers.  Not in sense of being precisely that number of nanometers, … but in the awesomeness of as yet unknown coding in DNA structures  with prime number-like uniquenesses, pseudorandom, …which just happens to show up to microscopists in unique circumstances, such as the cytoskeletal elements, that show up as “sets” of PRIME NUMBERs.

Desmoplakin KO desmosomal measurements (more thoughts)

Same paper as last post, just looking at the relative differences in the size and position of components of the desmosome.  See below…  pretty self explanatory, overall dimension might be close…. IF YOU consider that there is some other pressure for intermediate filaments (those little dots about 3.7nm  that i indicated ONE of on each micrograph) might have other restrictions on cytoplasmic position…. and in the case of a desmosome, just are tethered in by desmoplakin.  i found the collection of what i am calling intermediate filaments (the dots) near the periphery of the cell even in the absence of functional desmoplakin, and that was interesting i thought.

Desmoplakin KO desmosomes

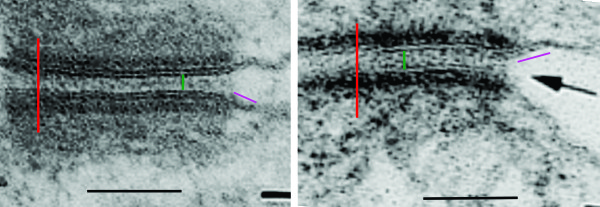
Here is an article by Gallicano et al, which I think has some interesting ultrastructure. They created a desmoplakin ko, and followed some of the changes in structure, but I think there might be more changes than they allude to.  I took two of their micrographs and measured (using their own nm markers) the height of the wt desmosomal plaque, the extracellular space and the ring dimension of the annulus… and i think there is an effect of the lack of desmoplakin on how narrow the extracellular space is, and also there is an absence of the very electron lucent layer just above the plasmalemma of the desmosome (just immediately intracellular, almost one could say, beneath the plakophilin and plakoglobin). Since the position of both those proteins as well as the intracellular portion of desmocollin and desmoglein are linked directly and/or indirectly, then it would be reasonable to think that the extracellular dimension (as well as the intracellular thickness of the outer and inner plaques as well as the whole dimension of the desmosome might change.

Extracellular dimension of the ko desmosome, 19nm (according to their own micron marker), and the extracellular dimension for the wt desmosome is ,pre ;ole 16nm. In both the wt case, the extracellular space between those adjacent cells is wider than what is found actually at the desmosome.  This is not that apparent for the ko.   Similarly the annulus protein seems to be longer (wt=26nm ko=35nm)(though tangential section could easily account for this).  Just interesting to see how subtle changes in the TEM are present. Red and black vertical and horizontal bars=100nm. Green bar=extracellular space at desmosome. Pink bar=desmosomal annulus. Loss of IFs in image to the right, reflecting lack of desmoplakin connections with intermediate filaments, and I think too changing the position, orientation, and closeness of the four+ other proteins comprising the desmosome. (mouse).  Looking again at these micrographs, they are most assuredly NOT the same magnification as was indicated on their micrographs.


Desmosomal diagram critique: 1

TOPIC: desmosomal diagrams

BACKGROUND: Desmosomes are cell-cell adhesion spots (not spot welds, but more like removable rivets, or bolts with phylanges, meshed with extracellular velcro-like (Ca dependent) intercellular hooks. Desmosomes are very specialized and highly ordered areas that incorporate many of these types of commercial connection devices. Velcro=desmocollins,desmogleins, double headed bolts or rivets=desmoplakin connectivity with the outer dense plaque proteins, and lock washers in particular the plakoglobin and plakophilin portions of the outer plaque proteins.  Desmosomes are commonly found in epithelialia, and I have seen them in particular right at the borders of the bile canaliculi in liver, at the apex of gut epithelial cells, and in kidney, and thyroid. I don’t think they are plentiful in lung, but I have not specifically searched for them there.  Of course desmosome-like junctions in heart, and muscle cells are unique adaptations of desmosomes. Others researchers have found them in thymus, cornea, and the central nervous system. Desmosomal protein isoforms and connections with filament proteins understandably are different in each cell type, and even with maturation state and location within the same tissue (e.g. different levels of epidermis). Electron microscopy (with electron tomography) remains the gold standard for studying desmosomes. Finding a good diagram of the desmosomal complex, identification of the desmosomal proteins and visual correlations with electron micrographs is not easy. HENCE the following post.

COMMENTS on one diagram:  I realize it is always risky to critique a diagram when on has not made a diagram for counter-critique. So please understand this is not a hostile critique, but a learning critique… it is the way I reinforce what is reasonable science and what is regarded generally as “fake data”  (ha ha… no deliberate reference to the current state of government and news reporting is made), it is instead an honest attempt to come up with something which is informative, and accurate.  The source of the diagram is irrelevant, since the purpose is to examine the content, not to criticize. I will just list the issues i have in bullet format.
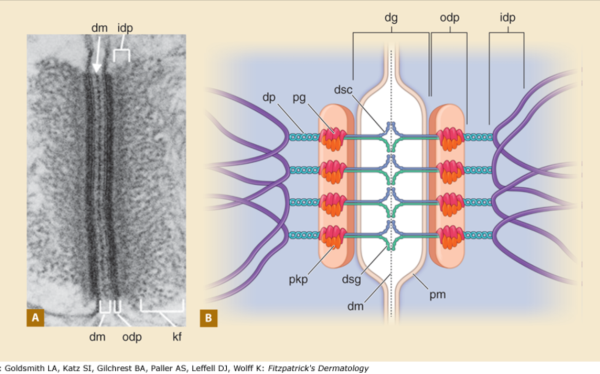

1) the area marked dg, desmoglein, includes the plasmalemma from both adjacent cells…. this probably is not accurate, I would not have commented had the bracket stopped at the outer leafelet of each plasmalemma.

2) dsg and dsc, desmocollin and desmoglein dont really connect in their N terminals as pictured here….  but seem (if one examines the electron microscopy) to be staggered. Even the staggered relationships between cell 1 and cell 2 in their own micrograph have the densities staggered (or alternating).

3) I havn’t seen any reports that say the desmocollin and desmoglein run as a single unit together in the intercellular space which is shown in this diagram.

4) given that desmocollin and desmoglein have a single-pass transmembrane domain and an extended portion into the intracellular space (in the outer and possible the inner dense plaques) it would have been nice to see a little bit of that passing through the red and orange twists that they have labeled pkp and pg = plakophilin and plakoglobin.

5) Since desmoglein does extend into the intracellular space and in this diagram is colored blue, it might have been a better idea to color the dp = desmoplakin some other color, since the continuity of those two molecules as the same color is confusing.

6) it is not tough to make things in relative ratios — a kind of internal scale and when something like the plasmalemma in the diagram is so tiny compared to the other drawn blobs, somehow it speaks to “inattentiveness” or lack of real perception than the need to fit a publication dimension or pixel level.  AND, it provides bad data to those who look at the diagram and learn visually.

7) it is actually kind of cute, the common copying mistake that diagrammers make when they try to depict something that someone else has committed an error on.  This particular error is soooo obnoxious that it makes me wonder if the scientists who requested the diagram know any more than the diagrammers who diagrammed the diagram.  The intermediate filaments in their own micrograph (left part of the image) are not these hairpin wired things darting in to connect with the desmoplakin molecules but they are seen as dots, or pretty much cross sections with a few that look like arcs.  Their diagram shows hairpin curved lines (purple) as intermediate filaments as they connect with desmoplakin but shows NONE of the intermediate filaments in cross section, ha ha, but 100% as arcs… this is just an error.

8) the periodicity of the outer dense plaque proteins (that would be a combination of desmoglein, desmocollin, plakophilin and plakoglobin and whatever portion od desmoplakin sticks in to connect as well is not defined in their electron micrograph. I do think one exists, and it has been reported to be the same dimensions (same number of nm between densities), but certainly can’t be borne out in their own TEM.

9) the central dense line (extracellular) where desmocollin and desmoglein attach, in the diagram they present would surely show a lucent dot, where they have their molecules coming together…  NOT as is typically seen, a definite density, and regular periodicity.

10) The desmoplakin twisted glue lines has two prominent areas at the N and C terminals which some have depicted as

So this if fun for me, again, not to aggravate anyone, but to identify which diagrams can be used to educate, and which need to be pitched as fake news.

Best desmosomal model so far, but still incomplete

“The cytoplasmic surface of intercellular junctions is a complex network of molecular interactions that link the extracellular region of the desmosomal cadherins with the cytoskeletal intermediate filaments. Although 3D structures of the major plaque components are known, the overall architecture remains unknown.” Al Amoudi et al, PNAS April 2011.
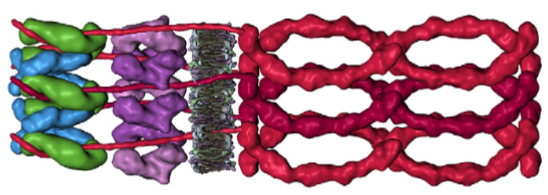
Theirs is the best diagram of the desmosome that I have found to date.
1) obvious lattice structure (periodicity)
2) intracellular lattice pretty much matches the periodicity of the extracellular lattice

“No intracellular molecular model for Dsc or Dsg “The structures of the cytoplasmic domains of desmoglein (Dsg) and desmocollin (Dsc) are not available. However, an alignment of their sequences with those of E-cadherin shows that most of the observed E-cadherin/β -catenin interactions are likely to be conserved in desmosomal cadherin/plakoglobin complexes. Therefore, we modeled plakoglobin-binding residues of desmosomal cadherins on the E-cadherin/β-catenin structure.” “Most of the cytoplasmic domain of Dscs (approximately 150 among approximately 200 aa) is modeled based on the E-cadherin/ β-catenin structure. The cytoplasmic region of Dsg is significantly larger and cannot be accounted for in our model. We speculate that the remaining region of the cytoplasmic domains of Dsg could span the region between the ODP and IDP, as proposed from sequence analysis (23), and thus it is not shown in our map of the ODP. According to Al Amoudi. Giving all credit to them, here is their diagram…. which needs some work, i know they know.  Firstly they have made the intracellular and transmembrane portions of the moleules (Dsc and Dsg) the same, which they say are not the same. Secondly… i dont think the figure 8 shape is what is seen in TEMs, sometimes yes, but mostly no… so the orientation of these molecules needs some adjusting.  Thirdly…  the inner and outer intracytoplasmic dense plaques are not the same relative sizes… but their molecules here are the same size…  and for all my observing of models of

Desmoplakin and IF attachments

I tried to figure out the transmission electron micrographs of an article on desmoplakin and intermediate filament attachment in cultured cells by Bornslaeger et al, The Journal of Cell Biology, Volume 134, Number 4, August 1996 985-1001 and really found the descriptions and TEMs difficult to interpret. Not diminishing their efforts, the micrograph B is clearly not the same magnification as the others which were all pinned under their micron marker of 100nm. Secondly they point to some strange thing as the IF in their first and second images (not shown in what i cropped as the left (A and B) images when there are IF that could have been pointed out just above the inner dense plaque. The IFs which are not connected to the inner dense plaque (they attribute to the loss of functional desmoplakin IF connections) are easy to see in E and E  (both from their figure E, i cut and pasted two portions from their figure). I guess they accomplished what they set out to acomplish… the diminution of the inner plaque and loss of densities beside-with-attached-to the adjacent IFs. I sure didnt enjoy reading this overly acronymish publication (haha).  Desmoplakin is an abundant molecule in desmosome formation, and accounts for some serious electron density  in the inner plaque region.  It is interesting, too, that the IFs are parallel to the plasmalemma, regardless of the blocking of functional desmoplakin, this orientation did not change from what is typically seen.

Insect septate desmosomes.

Michael Locke wrote a paper (rather a brief note) on the structure of septate desmosomes of a caterpillar (Calpodes ethlius). LINK HERE. It shows a possible arrangement of such a structure, honeycombed in one tangential array and in other cuts showing a parallel periodicity. The maganification bars on micrographs are not specific, i have to determine that they represent about 80nm, as remeasured using the size of an insect ribosome as the gold standard. I redrew a diagram (I am not sure why an 16 pronged asterisk like symbol was chosen for his diagram but it is reproduced and edited and overlies a portion of his micrograph of a tangential section of a septate desmosome. Another image from the same micrograph (enlarged to the same degree) has one potential that he recommended for the parallel section of the septate desmosomal honeycomb cells. His bar marker and the ribosome size are added to the images below. A larger scale diagram (slightly modified (with different planes of section that he provided) is included (red asterisk-like structures on the right lower portion of the png. His dimensions of adjacent plasmalemma being 14nm apart dont fit the size in the same micrographs of a typical ribosome. septa are more like 25-30nm lucent area and 40nm dark to dark line. The diameter of one hexagonal structure he named at about 105nm.

Just googling what the cadherins might look like in insects and other “bilateral organisms” using the term in the introduction of Sasaki et al, 2017 (LINK HERE) looking at those protein structures, correlating the differences in the extracellular EC repeats, might easily explain the differences in dimensions and organizations of these sepatae (and other) desmosomes.

ONE NOTE: it is clear that there are restricted positions where desmosomes in the mammalian liver are found…. mainly at the junctions of hepatocytes at the point they form the bile canaliculus….  reading from a review by John Pettitt (LINK HERE) he mentions that the classical cadherins are responsible in part for cell polarity.

JUST a note: in the lineup of  evolution, it looks like the transmembrane, and intracellular and the very close extracellular (right next to the transmembrane domain) dont change very much, compared to the pile of extracellular repeats and other kinks.

It is an awesome universe. Life is awesome and complicated. Learning about life is worth the effort required to maintain sanity.

Hydra desmosome dimensions

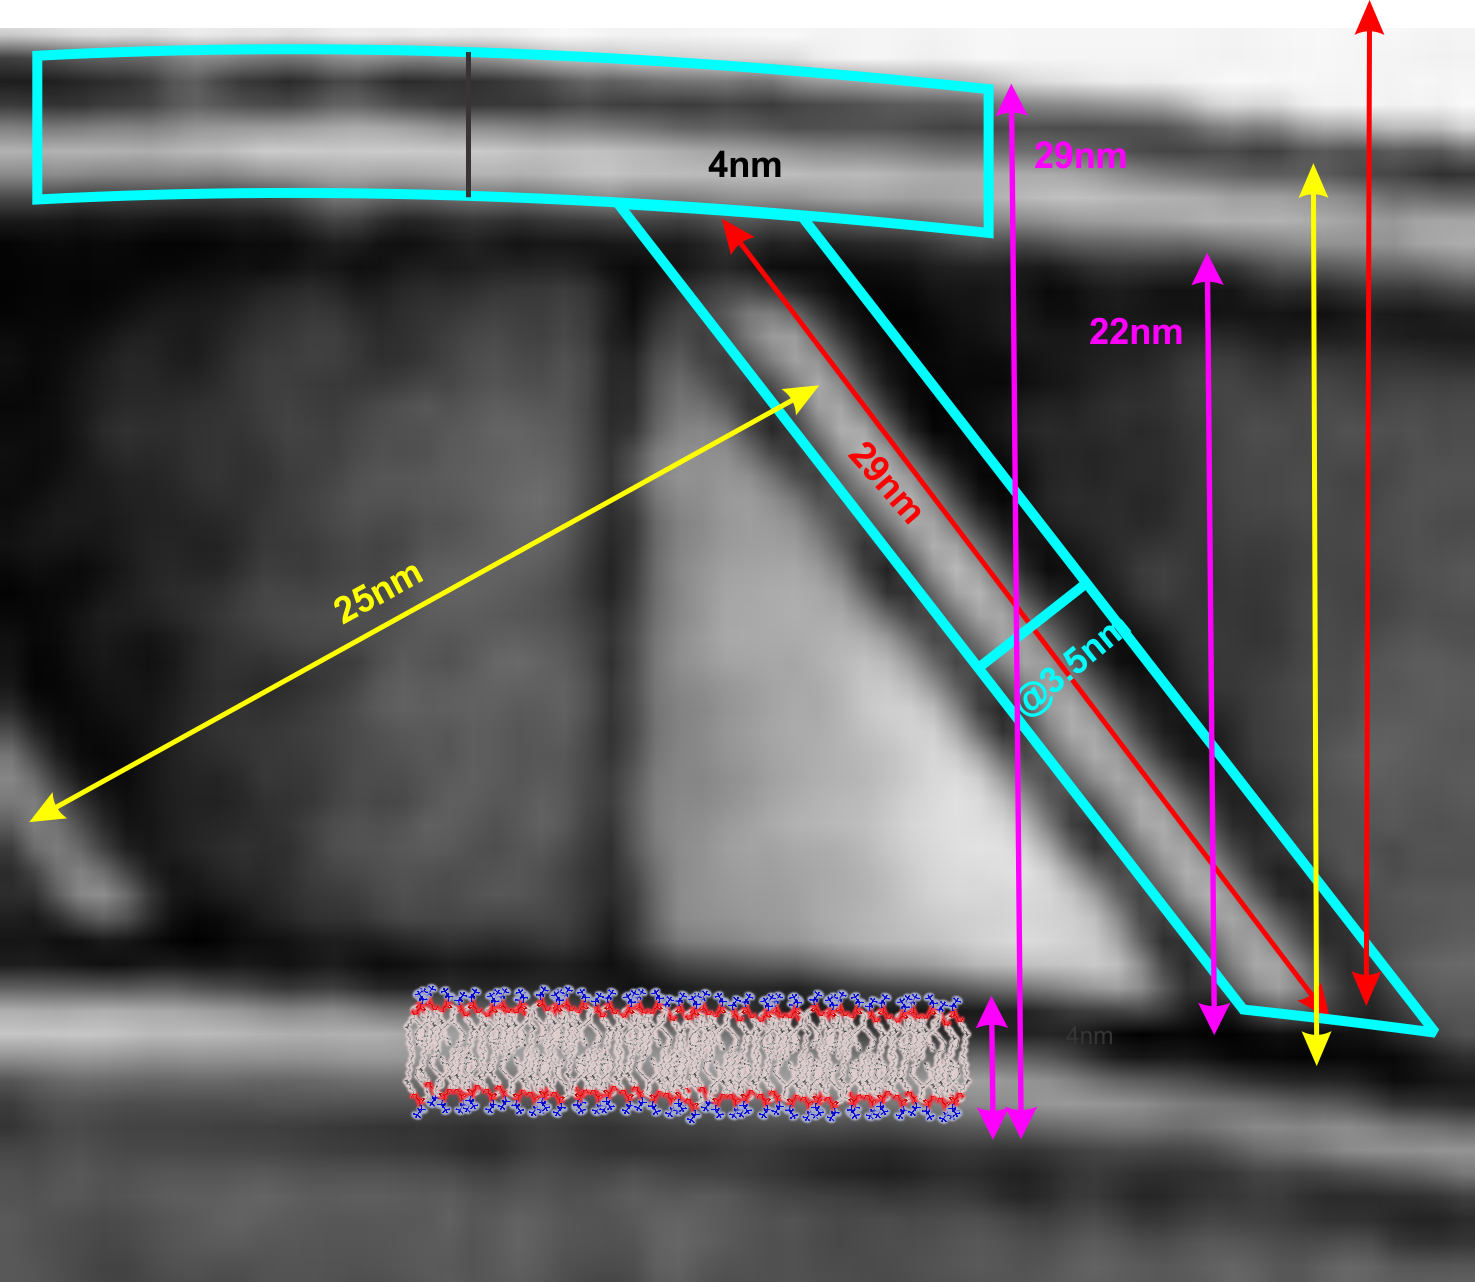
I found this paper on hydra desmosomes (if they can be called that, maybe better called intercellular junctions of the 3rd kind) just to compare with mammalian desmosomes. I pasted up a graphic from the diagram in this paper by Wood, in 1959, that shows the structure next to a mock up of the plasmalemma (about 4 nm thickness) and then estimated the thickness of the juxtaposed cell’s CADHERINS  ha ha… named such for lack of knowledge about what hydra intercellular adhesion molecules are — at this point –but i am looking). Interesting structure i think.  what is interesting to me is how closely the intercellular space (here about 20-30nm) matches the intercellular space of mammalian desmosomes. Another similarity of the hydra desmosomal structure is that the densities between cells are perpendicular to the direction of the plasmalemma, AND each layer of the trilaminar membrane of the plasmalemma is of a different density, this was called a plaque.

The distance between the “cadherins” is about 25nm, the intercellular distance in a non-desmosomal area of two cell connection he reports is about 20-30nm. This would be a difference with mammalian desmosomes since the intercellular space in mammalian desmosomes appears to be just a little less wide than when there is no junctional complexing going on.

I like the justification for many and for increased length of desmosomes, as this is a multicellular organism in which the need for protection from the extracellular milieu is critical.

Wood seems to suggest (which is in sync with mammalian desmosomes) that the “lamellae” as he calls them that are perpendicular to the 2 plasmalemmae of adjacent cells) are penetrated by elements of those lamella (similar to the way a transmembrane portion of a protein might behave).

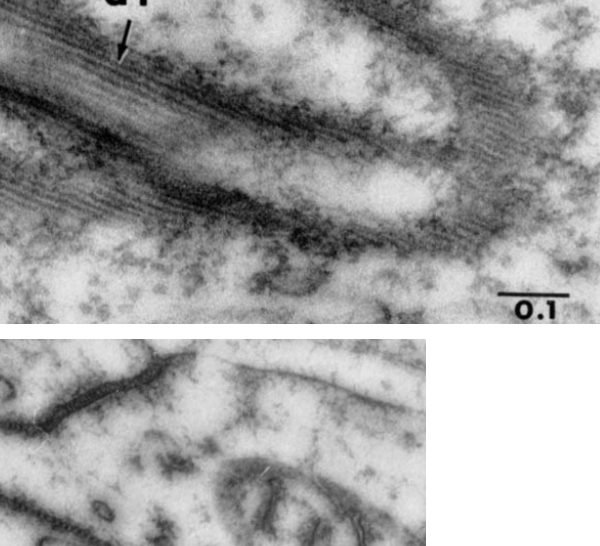
Micrographs at bottom are interesting, and show the layered grid of these septate desmosomes, and while not mentioned by this author, a very close mitochondrion is present (though not touching) the desmosome in the very bottom micrograph.