Category Archives: The cell: images

My style purkinje cell: ‘its a joke
I must have drawn this quick sketch of a purkinje cell decades ago, while cleaning out junk I found it and decided it was artistic enough to be a post. Clearly, I have a fascination with this cell type, remarkable, for sure. I think about my cerebellum when i jog (for exercise), as some of my best ideas spring to mind during that jogging…. thank you to these magnificient cells, and here is my rendition. You can see the tips of the dendrites have a lot of human things going on… hearts, smiley faces, peace signs. I wonder what mood i was in when i sketched it. LOL.


Middle and late pan apoptosis in livers of 14CoS ko mice
My quotes from an email to the PI of this project on 14CoS-/- mice treated with NTBC and withdrawn from NTBC. The electron microscopy on liver’s of these animals was really fascinating. Pan-apoptosis.”
Take a look at the nucleolar structure, the dense body (likely denatured DNA and RNA) right next to remains of the a nucleolus and “notice” the regular pattern of striping (lower image, enlarged from square in right hand image above. Left image, earlier apoptosis with lace looking nucleolus with lots of fibrillar centers, and right, fibrillar center with dense RNA and/or DNA probably laddered.

“NTBC withdrawal in 14CoS/14CoS but not in ch/14CoS mice leads rapidly and progressively to apoptotic changes in hepatocyte nuclei. Early apoptotic changes were not associated with inflammation, however after 48 hrs some polymorphonuclear cells were present in the sinusoids. Isolated apoptosis need not induce an inflammatory response, however, when more three quarters of the hepatocytes are in some stage of apoptosis, the absence of inflammation is not a realistic expectation. The endpoint of both apoptosis and necrosis is in fact the same, cell death.” ”
“Mid-apoptosis is defined as hepatocytes where nuclei exhibit considerable peripherally condensed chromatin and unusually large nucleoli with very prominent fibrillar centers. Late-apoptosis is defined as cells where nuclei are pleomorphic in shape, have large clumps of chromatin condensed radially, an intervening nucleoplasm without texture, and show a disruption of nucleolar aarchitecture. Necrosis is defined as a swelling lysis of the entire cell, loss of membrane integrity, with debris everywhere. All histologic assessment was done using a blinded protocol. Percentages were calculated by dividing the number of apoptotic (or necrotic) cells by the total number of hepatocytes counted (>500 hepatocytes per animal), multiplied by 100.”
I am not sure how many or which of the countless images of hepatocyte nuclei ever made it into a manuscript but here is one image below where mitochondria have a very peculiar transformation.
Muddle of purple and blue: gastric epithelium as fabric art

Toluidine blue stained thin plastic sections of parietal cells in the stomach of a mouse (experimental strain). Image processed, probably in photoshop. Would love to have a scarf with this print.
Are there angle restrictions on distribution of SP-D trimers in fuzzyballs
Looking through as many SP-D images as I could find in the literature I began to sense that the distribution (radial) of SP-D dimers was not random. I am determining the angle of separation of each arm of a SP-D fuzzyball to see if the numbers fall into classes of small, and larger. The data for these three pictures is spot-on. Various authors are responsible for these electron micrographs, i give them credit..they are not my personal photos. Images on the right and left are shadowed, image in the middle is AFM.
To create the round “generalizations” of angles in SP-D fuzzyballs, the actual angles were measured in the molecules below. A mean was obtained for each angle-set: e.g. the center pix had 4 measurements, as follows: I will measure all 90 images and see if the trend holds.
147.46
127.6
41.62
43.32

Molecular and macromolecular architecture follows patterns
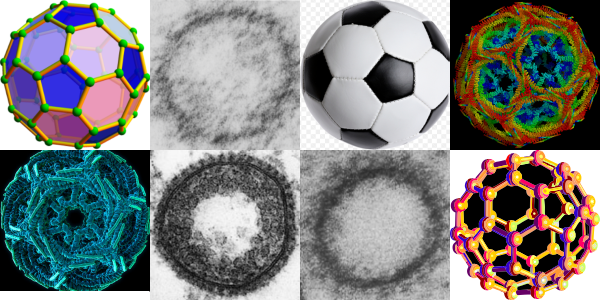
This is a wild goose chase looking for structures which explain and identify those which I have seen repeatedly in hepatocytes (and other cells), this time including clathrin coated vesicles and COPI and COPII vesicles. I am continually amazed how certain motifs repeat themselves in the microscopic, molecular and modern world. Stability in structure seems to transcend size. So image below is a collection of fullerene diagrams, some from my own electron micrographs, one from a widely republished electron micrograph (credits to the author if i knew who it was) and some from various wikipedia posts and of course the most widely recognized fullerene structure… the soccer ball. Just for fun but also tying in the concept that nature made it first. There is a difference in magnification from the upper left (i think around 1 nm – which actually sounds too big to me) — to the soccer ball 22 cm in diameter — well you can do the math 2,200,000,000 nm.
Superballs vs fuzzy balls: immunity
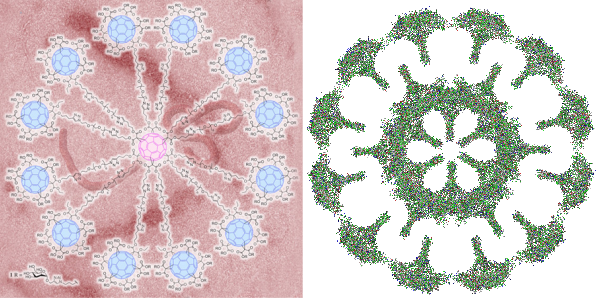
I got into searching for the structures of clathrin, COPI and COPII and one website visit after the other led me to this link. There headline was “Globular glycofullerene molecules prevent virus from evading immune system and entering cells” and I got goosebumps when i thought to myself that the surfactant protein A and surfactant protein D fuzzy balls might very well act as these proposed superballs in inhibiting infections from those viruses which have developed the reverse method for “entering” cells and avoiding the immune response (ebola and HIV for example). Seems a really fun thing to research. I posted a picture of what i designed as a surfactant protein A fuzzy ball (surfactant protein D makes fuzzy balls as well) and immediately saw the similarities between the octadecamer glycoprotein protruding in a sphere in both these fuzzy ball naturally occurring innate immune functioning proteins and the one that was produced by synthetically. Nature figure it out first.
BTW i dont like how the EBOLA virus is tangled within the backdrop of the globular glycofullerene on the left, called a “superball”, in fact it is kind of “nonesense” to me…. I could however envision the EBOLA virus stretched to oblivion as if stuck to a round velcro sphere, with areas exposed for digestion and removal. It has been stated that EBOLA type viruses (EBOLA is a “Filoviridae” virus and older than previously thought). That group of viruses has been interacting with mammals for several between 5 – 23 million years and it makes perfect sense that some sort of defense mechanisms have arisen in parallel. In fact a little bit of searching shows up this reference on filovirus entry.
 s
s
Certifiable? or does rRNA on RER rock
I was looking at liver electron micrographs, looking for mitochondria, trying to see whether cristae juntions are such a noticeable feature as is claimed, boy I can not find them easily. But in “boredom” not really boredom, more frustration, I decided to punch in a “kick” beat to the spacing of ribosomes along the RER membrane. I hope this fun time with Fruity Loops doesn’t distract me from doing real science…. as I can see how fun it would be to use a top hat, steel drums, cymbals, for some ribosomes a little further away, and a base beat for those that are very clear and a blip for those that are faded out and then play two tracks together (opposite sides of the ER membrane being a separate track each). Now you know why I chose the title for this post “certifiable” (i am not crazy, as sheldon cooper says, my mother had me tested),

Ultrastructure of some mitochondria and RER associations
It is really likely that some of the patterns in electron micrographs (even though they were taken decades ago) can still reveal some of the unique ultrastructural architecture that cells possess, even new and useful data. (This is an apologetic of sorts, since I don’t have the latest in tomographic equipment or a wet lab but still find amazing structures in the old TEMs i have lying around.) So these images are offshoots of a previous post on mitochondrial substructure, and I noticed two new things in this same micrograph. That is:
1) that one of the mRNA and ribosomal spirals has a dense center and from it radiate spokes (red arrow in left and top middle images) and…
2) there is a portion of mitochondrial matrix? intra cristae? area which is clearly organized into repeating parallel layers with central dots. (this is best seen in the images to the far right. The boundary between mitochondrion and RER is black dotted line, lower images on right; black box on left is area enlarged (top and bottom middle) one with contrast enhanced (bottom) and one set of mRNA+ribosomes spiral, and black line marking line likely mRNA, and to the left at the red dots a vertically oriented multilayered organization of mitochondrial (membrane?) cristae… the black box surrounding this particular area of interest denotes the two images to the most right. There is no question about the organization of vertical-parallel lines, and dots. These are the blue dots in the two lower right hand figures. Vertical lines with vertical organization of the rounded densities is quite striking (upper right). This is mouse liver, neg 6118, block 5220 and from my notes it received tween and PP5 at 50mg/kg and this is a 72 hours necropsy. Right top is same as right bottom, where the central dense dots and outer dense line – substructure is observed.

Mitochondrial ribosomes: where was I
I googled “mitochondrial ribosomes electron microscopy” and expected the first citations up to be pretty recent…. nope, this one Kleinaw Neupert and Miller (not this miller) 1974 popped up. Stating the obvious, muscles in the migratory locust certainly displayed many structures which were purported to be mitochondrial ribosomes. Two particular images caught my attention: isolated cytoplasmic ribosomes and isolated mitochondrial ribosomes. In the “older” publications micron markers were required so this made it easy to determine the approximate insect cytoplasmic ribosome size vs that of the mitochondrial ribosomes (and at the same time look at the cristae for clues as to the ATP synthases-related bending and also to look at what might be something akin to mitochondrial pores at the base of cristae). Just as an aside here, the materials and methods sounded like a trip down memory lane for me, ha ha… though i used the Siemens Elmiskop model 1A introduced in about 1964, older than the 101. Anyway some interesting measurements from an image here presented below.

About X=16nm is the distance between periods in the rhythm I see along side the mitochondrial RER tether. This is based on the micron marker from the publication and also an estimate of ribosomal size from the micrograph itself shown on the image. Cytoplasmic ribosome about 21nm here, mitochondrial ribosome is about 15nm. Black bar micron markers 100nm and area enlarged is the box in the image at left. Left image has the mitochondrial portion outlined in red (as it is also in the insert with the cytoplasm there on the right side, mitochondrion on the left.