


Category Archives: surfactant proteins A and D
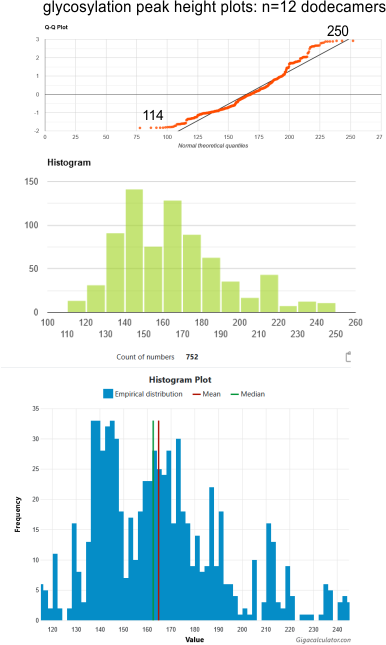
Histograms: glycosylation peak height – 12 dodecamers
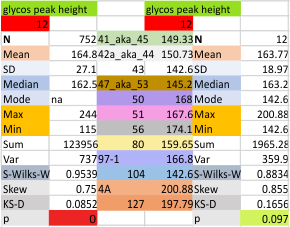
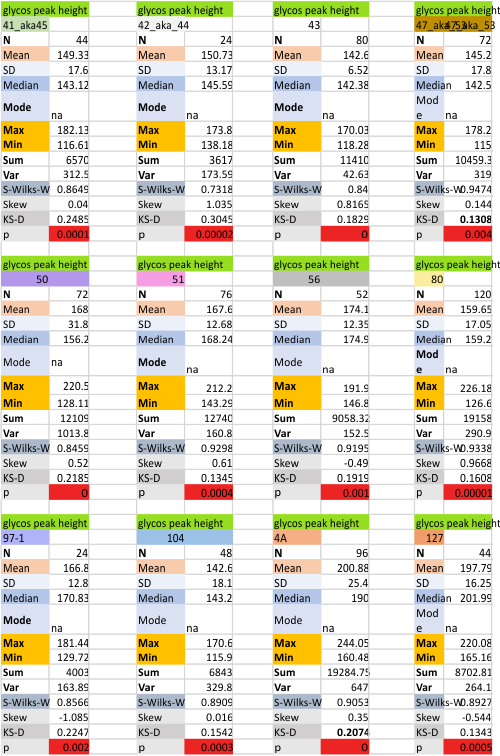
It is easy to see where some images of SP-D dodecamers are not as well defined in terms of peak number as others. Peaks to the left of the mean, meadian, are found here. Kudos to the makers of calculator.net and gigacalculator.com. Being a visual person, their Q-Q plots, histograms and various little round indicators of significance and especially calculator.net, their explanations, oh and the Shapiro-Wilks calculator. I thank you all.
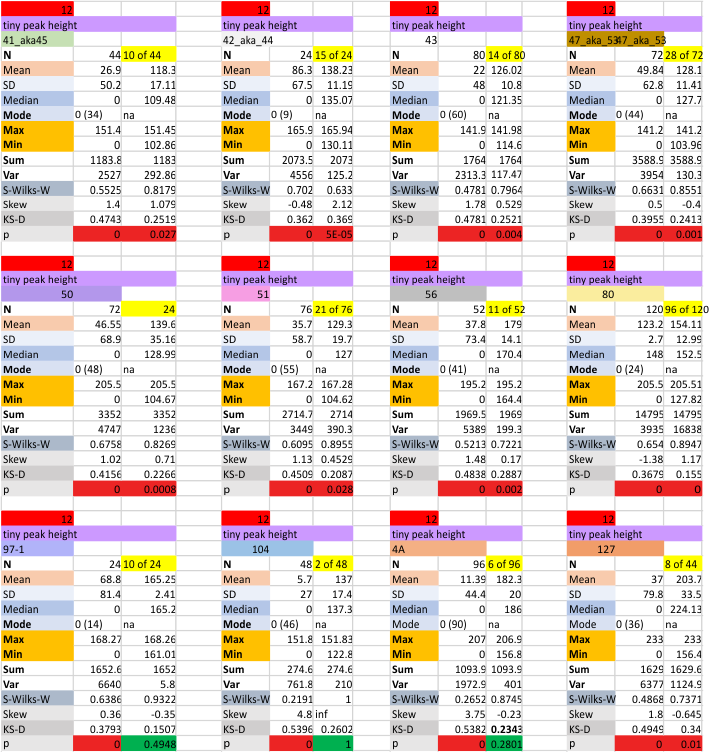
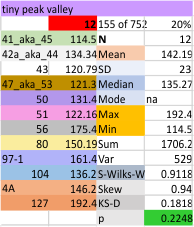
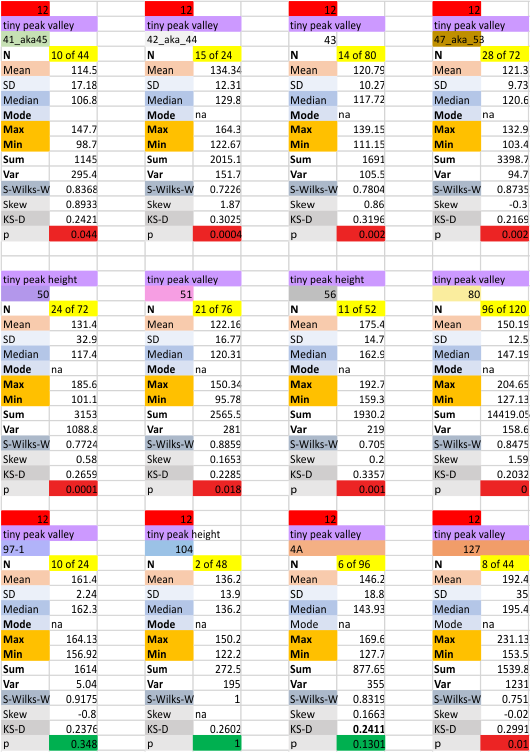
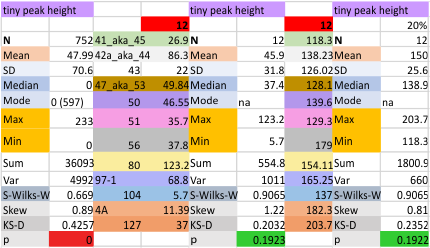
12 dodecamers of SP-D: Tiny peak height and valley (grayscale 0-255)
This very thin and small peak is detected about 20% of the time on the downslope of the very large N term peak. I checked to see whether the image processing peak finding was any different in terms of detection than the combined image and signal processing functions and they were virtually identical (missing 79% of the time, detected 21% of the time).

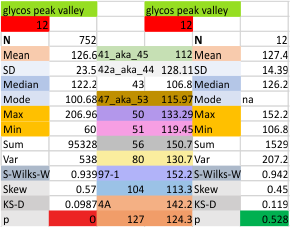
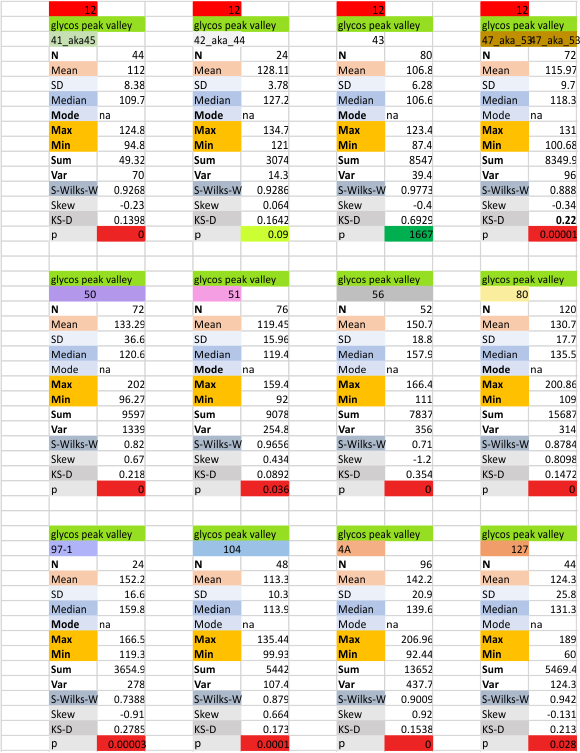
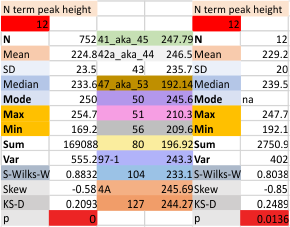
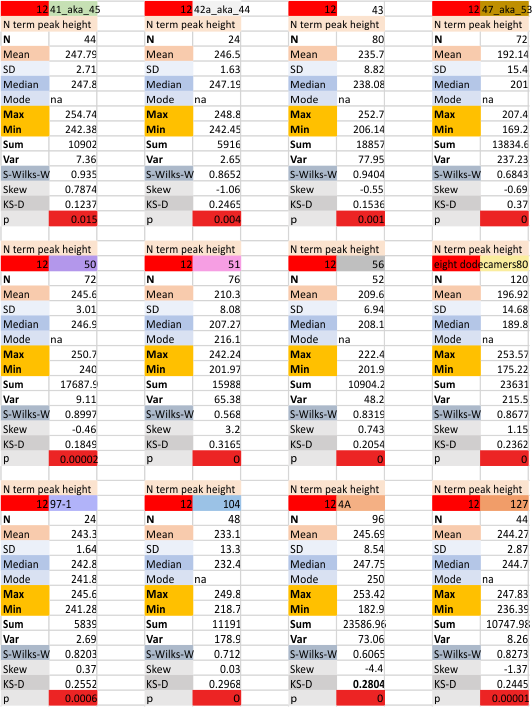
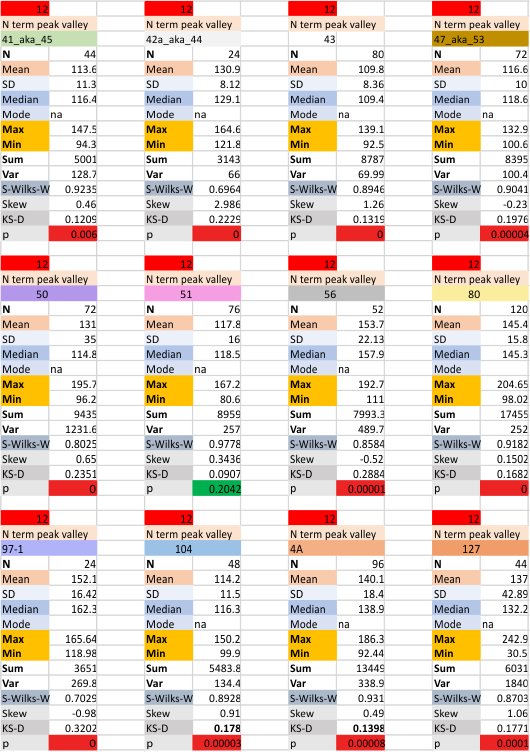
12 dodecamers of SP-D: N term peak height and valley (grayscale 0-255)
Same layout and procedures as before. N term peak height data from 12 dodecamers of SP-D. Grayscale values for peak height and valley determined using ImageJ. N of 752 is the total number of trimers in 12 dodecamers using dozens of images, image filters, and signal processing functions. INdividual dodecamers listed as well as a summar.
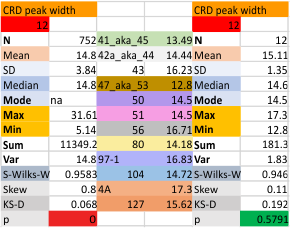
12 dodecamers of SP-D: neck peak and adjacent carbohydrate recognition domain peak width (peaks 7 and 8)
12 dodecamers of SP-D: neck peak and adjacent carbohydrate recognition domain peaks (peaks 7 and 8). images below are in the same basic format. Coiled coil neck peak width, and the peak width of the carbohydrate recognition domain.
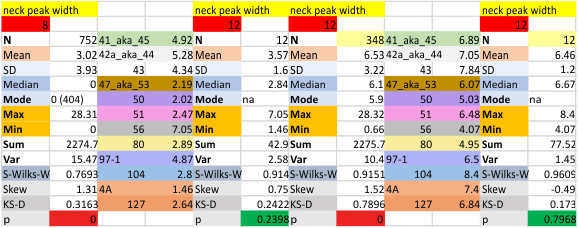
DIfferent numbers of data in columns from the neck peak to the CRD peak are the result of the fact that the CRD peak is present 100% of the time, while the neck peak is seems to be present (as in not detected because it is likely folded under one of the CRD domain’s globby structure. I calculated including the undetected (as 0) and deleted the 0’s and recalculated).
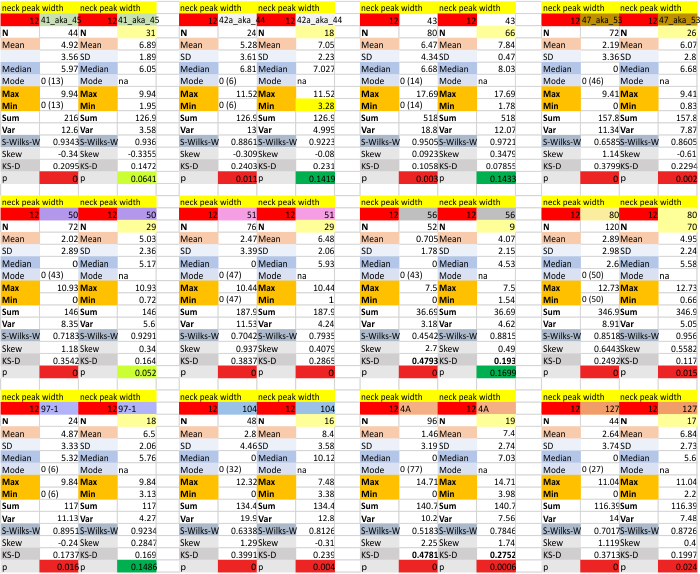
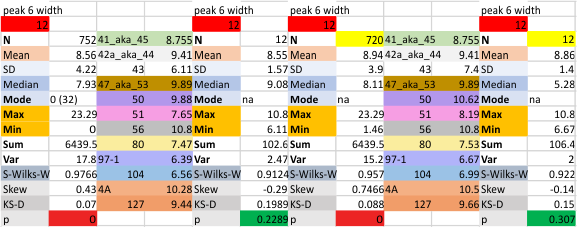
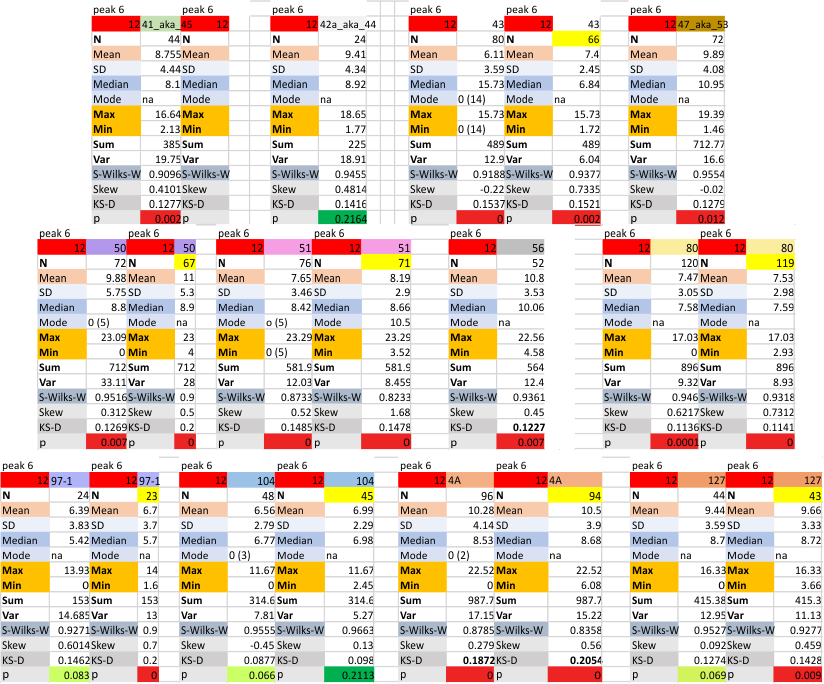
12 dodecamers of SP-D: peak 6., just before the coiled coil neck peak
12 dodecamers of SP-D: peak 6., just before the coiled coil neck peak – this peak occurs much of the time, but not 100pc. number of missing (undetected) peaks in the area of peak 6 is shown in the line for mode… with a zero and parenthesis of the number of absences). In several cases a dodecamer would show a peak in the area of peak 6, 100% of the time. These columns of statistics will NOT have an adjacent column of statistics (top is yellow) correlating with the values MINUS the undetected peaks (e.g. the first two and the fourth dodecamers on the second row of data have no column with a yellow header, thus all measured hexamers had peak 6 on each plot.
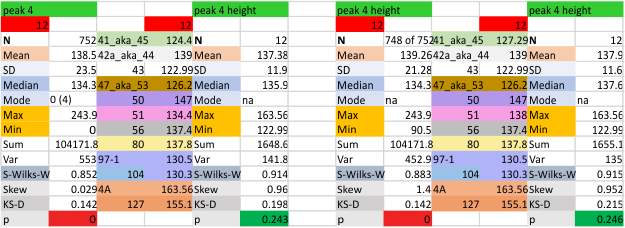
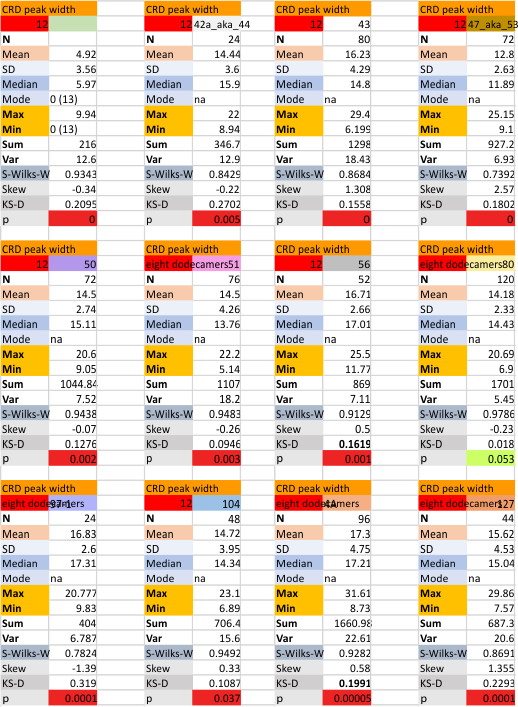
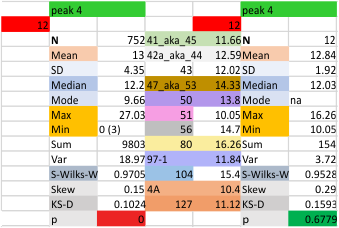
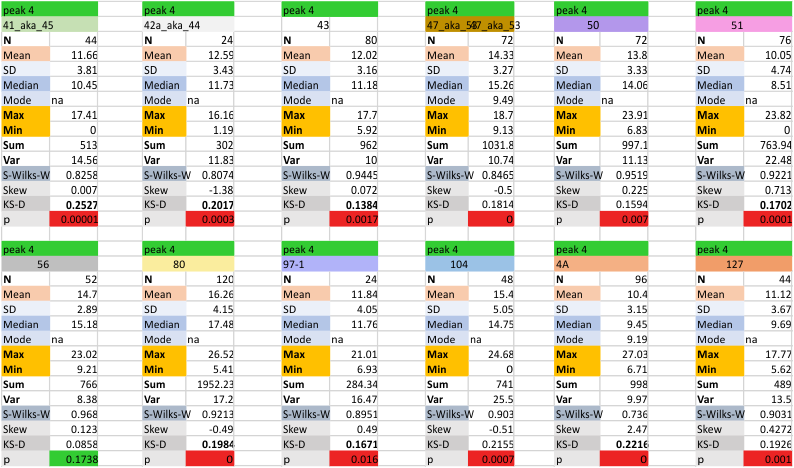
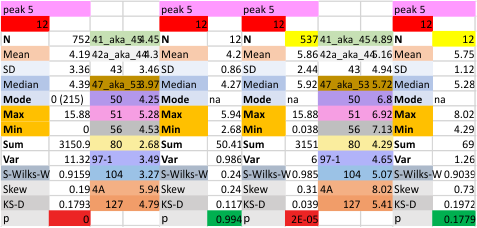
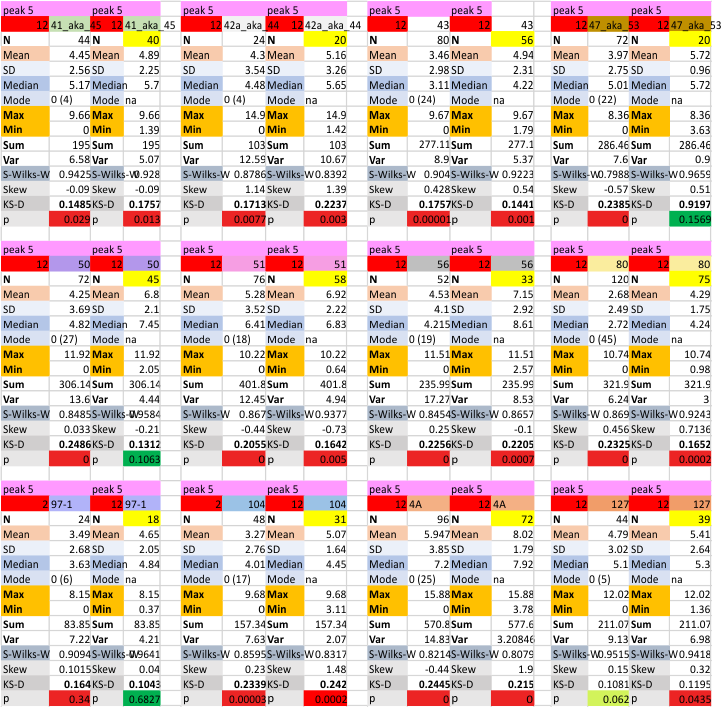
12 dodecamers of SP-D: glycosylation peak and adjacent peaks (peaks 4 and 5)
The approach to the statistics is the same as has been used before. The summary has two elements if there are any missing values. if there are none, or as in the case of peak 4, only one or two out of several hundred, then i have just left them in. If the missing values (see two bottom sets of plots that are the values found for peak 5 are several percent of the total (recall… peak counting here begins at the N term and moves left to the CRD and width is reported in nm, as determine for each image by the bar marker provided by the author — which… can vary btw) , then there are four summar columns (one set with missing values calculated in as “0”s, and one set where they are left out). In these data, peak 4 (adjacent and lateral to the glycosylation peak in SP-D) is about 13 nm in width at the valley, while the peak adjacent to peak 4 (peak 5) is less than half that wide at 5.7 nm.
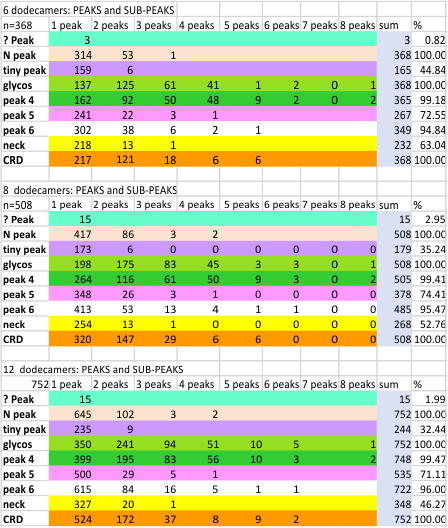
Total peaks and sub-peaks per peak from AFM images of 12 surfactant protein D dodecamers
 BOTTOM LINE (lol here at the top) Do signal processing apps work for detecting variations in symmetrical, and mirrored images? and do they have as much bias (from the math in the algorithms – lag-threshold-smoothing-distance-height-bla bla) as the human brain — albeit different bias) — is a combination of image, signal, and NO processing best, or useless?
Summary of peaks found per hexamer (12 dodecamers, 376 hexamers, 752 trimers), each plotted for grayscale (LUTs) with ImageJ and either counted from the image by hand, counted by hand from the plot produced by ImageJ, or peaks counted from the latter using a peak finding functions (Octave (Findpeaksplot,xy; ipeakM80), Scipy, Lag (smoothing) Threshold (z-score),Influence (moving mean and SD) (stackoverflow), and a PeakValleyDetectionTemplate.xslx (smooth 11) available from Tom O’Haver. Images were mostly those from a published article by Arroyo et al.
Peaks found previously to be about 15 per hexamer. This was used as a base, as it was also the most commonly found “visual” ID of trimers and hexamers of SP-D looking at images taken at the atomic force microscope (AFM). Grayscale plots were made in ImgeJ, and peaks numbers assessed by many signal processing functions and also using the image, and the plot formed by ImageJ.
This process has been used on at least 4 iterations (three shown below) to determine the number of peaks in any hexamer of SP-D. Hundreds of plots subjected to image filters, and/or signal processing functions resulted in the table below: summaries from a total of 6 dodecamers, 8 (previous 4 pluts 2 new molecules) and 12 dodecamers (8 previous and data added from 4 new dodecamers.)
The sort from the peaks found with signal processing functions were galthered together to comply with the mean peak number value of 15 per hexamer, found previously.
Three peaks (N term, glycosylation peak, and the CRD peak are present 100% of the time. There are two additional peaks that are present at 99% of the time, and 95% of the time which clearly need to be added to considerations of molecular shape. The neck peak (yellow) is very often covered by the CRD peak (three lumps in the trimer which can lie in many different positions on the mica before images are taken), shows up about half the time. This is when the CRD domains fall away from the center line traced with the segmented line in ImageJ.
Two other peaks appear less frequently, one is peak 5, which is seen about 74% of the time, is narrow and a low unimpressive, yet definable peak. The peak called “tiny peak” (purple color as ID) occurs less than half the time: two reasons for this, the big one is that signal finding functions base their peak detection on characteristics of the previous peaks. The tiny peak is on the shoulder of the tallest, broadest peak in the hexamer, and thus influences the counting of peaks before and after.
1: ways to combat this are to “count them myself”,
2: plot the segmented line in both directions and compare the outcome
3: fine tune the signal processing functions to detect even the smallest peak (this however translates into dozens and dozens of detected peaks which are not relevant, but represent pixels primarily).
Dividing up the results into the peaks that i counted from the image and the ImageJ plots, and those which were subjected to signal peak finding apps, there is a difference but it really involves the detection of peaks that do not fit into the “15” per hexamer, that was found with all filters and functions previously. That doesn’t mean that the number “15 peaks per hexamer” is never to change… so that means more molecules to check.
Number of peaks along hexameic arms of SP-D
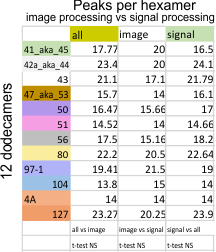
Number of peaks along hexameic arms of SP-D: More dodecamers added to this dataset shows that the number of peaks using AFM images published previously by Arroyo et al, continues to hover around the 15 peaks/hexamer mark. This is surprising in a way since i deliberately chose the first few images as the “best” and most clearly defined images of SP-D and expected the number of peaks detected (by all filters and functions) to decline, but in fact it did not. This mean is a summation of all 24 hexamers from all processing apps and all molecules examined to date. Figure below these data are those for each dodecamer.

This actually is supportive of the fact that there are two very regularly seen very small peaks between the glycosylation peak, is very thin, and does not demonstrate a great difference in height compared to valley. And also, the peak just before what could be a group of flopping CRD domains, with a small neck domain peak just before and between those three large dense consistent ‘multipeak’ peaks seen by AFM. A peak that would likely be the neck domain sometimes occurs in about half of the trimers. This sometimes “detection”, is also similar to the intermittent visualization of a very tiny peak just between the N term peak and the glycosylation peak.
 Ablve is a summar of all the image filters, and all the signal processing functions that have been gathered for the first 12 dodecmers. Not all filters and f unctions were applied to all images, but the settings on the filters and functions have become a stable set.
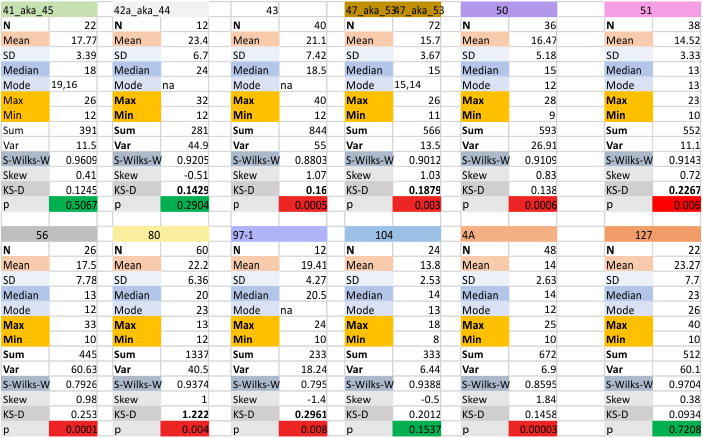
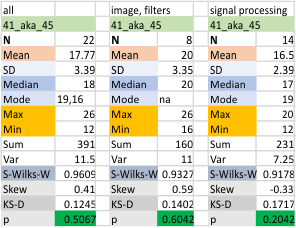
Below, each dodecamer (named and color coded) is given a repeat of the all inclusive statistics (image above) but also divided into two groups (my peak counts from the original images) my peak counts from the plots obtained (all the same pixel width for a segmented line through the hexamer arm) and all image filtering and signal processing.
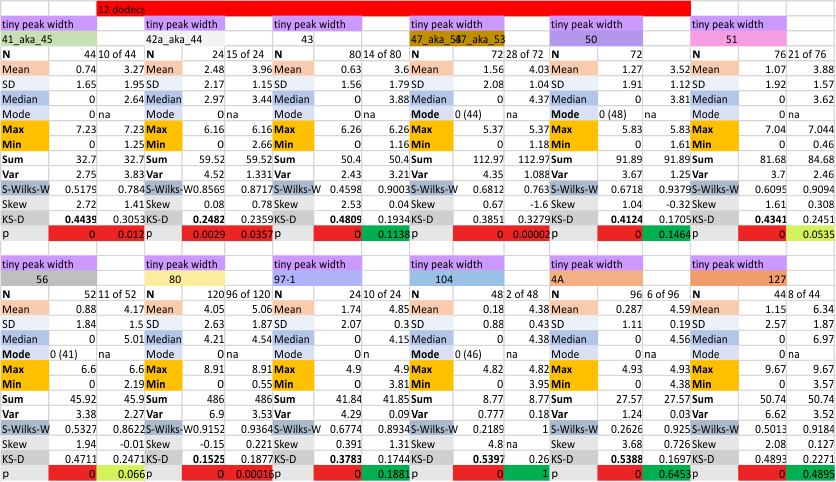
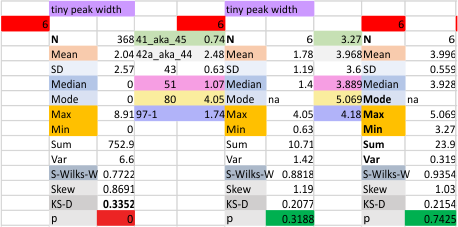
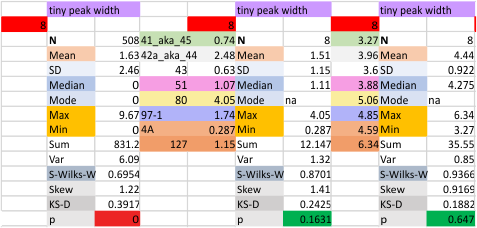
12 dodecamers of SP-D: tiny peak width about 4nm
The “not always” found tiny peak on the downslope of the N term peak seems to give consistent data, reagardless of the fact that it is often not detected as a peak by signal processing or even image filtering techniques. I have seen it in images too many times to ignore it. It lies just between the N term peak and the glycosylation peak in surfactant protein D dodecamers (AFM images, by three researchers in three separate labs). It would be prudent to subject trimers to peak analysis to see if it is seen at the same frequency or whether it has something to do with the N term junctions in surfactant protein D multimers. So images below show means and other statistical info for analysing the tiny peak width, left hand columns, using all non detected values, right hand columns “NOT” using the missing values. The addition of 2 and then 4 more dodecamers to the list of those measured follow below in the same organization.
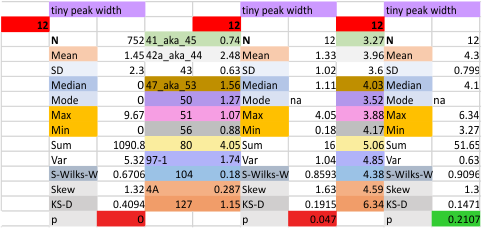 individual data below — sometimes i find an error, and correct it… so there will be tiny discrepancies between this list and previous lists, but so small as to create little change in the data.