Supplemental figure 4 I is the same figure (almost) as the cover image for Arroyo et al. I see that middle right of figure 4 becomes top middle of the cover figure, thus a 90 degree counter clock wise rotation with a horizontal flip. The figure is cropped slightly to fit the orientation of the cover but since there is no insert the former shows more molecules. The cover image is slightly squished horizontally compared to Figure 4, but I am going to assume that any manipulations of ratio of height to width would have been done in the cover not the original image (probably not a good assumption). Top figure shows the cover in near-perfect alignment with Supp Fig 4, bottom figure shows cover and Figure 4 I side be side. So measures of the cover images can be subjected to morphometry (as duplicates where they are duplicated, and as additional images where they are not previously measured using the Supp Figure 4 dodecamer bar marker.
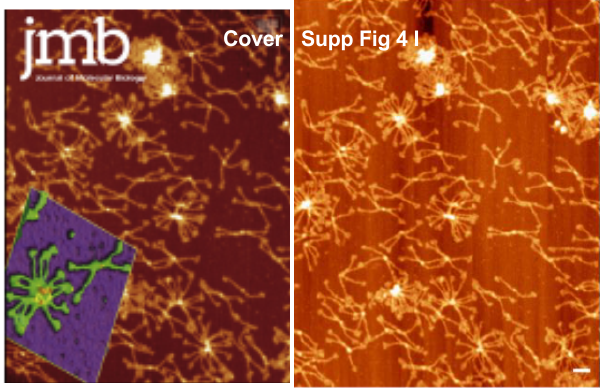
Daily Archives: April 8, 2020
After a long hiatus (likely influenced by the current stay in place mandate) —
After a long hiatus (likely influenced by the current stay in place mandate this year) — I am posting the mean diameter of the SP-D images from the supplemental figure in the manuscript by Arroyo et al. Diameters calculated by the same two methods mentioned countless times in this blog before: diameter and segmented (node or cusp)-arm length).
Specifics are:
n=196 (three measures per dodecamer with a rare SP-D molecule with five arms, or three arms included)
Sum, Σx: 26012.577
Mean, μ: 132.7172296
Variance, σ2: 108.7097499
sd 10.426
BTW, SP-D becomes a hot topic in todays coronavirus pandemic. THough retired, I am anxious to do some work on whether SP-D might behave with this SARS Cov-2 virus as it does with SARS Cov-1
I had two sets of 3 measures each from two images in Figures 3 and 6a in the original article which I compared to identical images found in Figure 4 of the supplement. So this is a duplicate measure, two different times (half a year apart) but using the same techniques (which is to use the authors micron bar marker to determine the diameters of the SP-D molecules using two methods (1) an actual diameter measurement — where the circumference touches at least three of the four CRD in a single molecule, and 2) vector lines from tip of the CRD to the other CRD for each hexamer) sugjected to a t test which did not turn up a significant difference in the measurements made: (The t-value is -0.30062. The p-value is .769863. The result is not significant at p < .05.) That is encouraging as the values include any errors in the bar marker and any of my errors in translating the bar markers into nm in my image measurements. That give a little more credence to the methodology, however I still will compare Figure to figure and especially the cover to the other figures in that paper.) That there are differences in the size of the SP-D images from one figure image (with bar marker) and others seems likely to show up