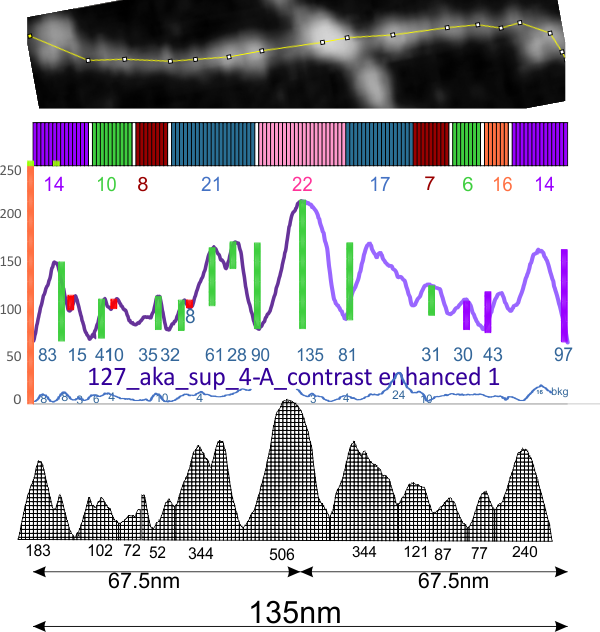
1 to 12 grayscale values are going to be considered background in this particular image (8.37+4.7, N=24, so the outside limit would be 13 grayscale units – 13/255 (5%). This value will be used in the duplicate plots of a single hexamer of the dodecamer I have labeled 127-Sup fig 4 which was published by Arroyo et al. I do not know if there is another analysis i can apply to these images. peak height, subtracting any peaks that do not exceed the height of mean background peaks, nm width (standardized), and sq nm.
 The CRDs in this particular image are about 140 sq nm.
Monthly Archives: May 2020
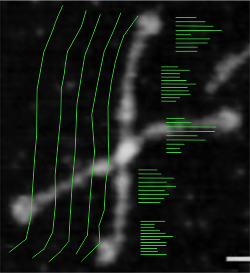
Spline curve measuring SP-D dodecamer arm length
Spline curve measuring SP-D dodecamer arm length with the original AFM, with that image saved to grayscale as “averaged” “lightness” “luminance” and “contrast enhanced in photoshop” shows no significant difference in the length of an arm (One chosen by chance from dozens of images and measured at least five times for each color, and grayscale conversion algoriithm, and also manually contrast enhanced in photoshop) does not cause significant difference in that length . This is good news since many programs don’t register (or make available) the algorithms used to convert RGB to grayscale. Bottom line…. using discretion… it does not seem to do any much difference: Left: contrast enhanced, right: original RGB (saved from arroyo et al).

Scores Calculations
Treatment 1 (color image five tracings of vertical dodecamer)
N1: 5
df1 = N – 1 = 5 – 1 = 4
M1: 147.64
SS1: 31.07
s21 = SS1/(N – 1) = 31.07/(5-1) = 7.77
Treatment 2
N2: 5
df2 = N – 1 = 5 – 1 = 4
M2: 147.67
SS2: 136.47
s22 = SS2/(N – 1) = 136.47/(5-1) = 34.12
T-value Calculation
s2p = ((df1/(df1 + df2)) * s21) + ((df2/(df2 + df2)) * s22) = ((4/8) * 7.77) + ((4/8) * 34.12) = 20.94
s2M1 = s2p/N1 = 20.94/5 = 4.19
s2M2 = s2p/N2 = 20.94/5 = 4.19
t = (M1 – M2)/√(s2M1 + s2M2) = -0.03/√8.38 = -0.01 (except reduce the level of noise).
RGB to grayscale algorhithms – and optimal contrast: LUT plots
The human eye is a great thing (at least when its working in conjunction with an great occipital cortex.
For at least 2 years I have been trying to get the most information out of micrographs (AFM, TEM) of surfactant protein d just to determine how many peaks in brightness (luma, luminescence, lightness, brightness, whatever!!) and going through the whole lot of grayscale conversions and assessing the LUT tables for peaks and valleys in SP-D, i have come to the startling conclusion that the best plots are obtained when “I” that is my “eye” tells me that i have found a good balance between contrast and brightness, reduced the background to a tolerable point and have not lost any detail. Out of four programs, I think my eye is best. LOL. That sounds totally unscientific, and I will provide the plots to demonstrate that the quality plots are when i determine the brightness and contrast…. next best might be using “luma” to convert RGB to grayscale. The typical method (averaging RGB) is really not that great. Just saying… i am providing dozens of plot to verify… but the best plots come when I adjust the parameters.
This sounds like bias…. nah…. its the same as training AI.
Just for fun coronavirus virus models: my entertainment during the first half of this year.
| Refrigerator magnets, christmas tree ornaments, keychains, bracelets earrings, counted cross stitch patterns, stained glass virus mandala patterns, all things to remember the pandemic, Coronavirus, Covid 19, Sars Cov 2. | ||
 |
||
 |
 |
 |
| Refrigerator magnet models of the SARS Cov 19 coronavirus – covid 19 | ||
 |
 |
 |
 |
 |
 |
 |
 |
 |
 |
 |
 |
 |
 |
 |
| Decorated eggs – models of the SARS Cov 19 coronavirus – covid 19 | ||
 |
 |
|
| Bracelet charms – models of the SARS Cov 19 coronavirus – covid 19 | ||
 |
 |
 |
 |
 |
 |
| Counted cross stitch of the SARS Cov 19 coronavirus – covid 19 – model | ||
 |
 |
|
Not a big difference in the impact of color, grayscale conversion, average, lightness, luminosity: yippie
Just going back to cover the steps in analyzing the micrographs of SP-D (as painful as that is) makes me pretty sure that the variations in grayscale value (even in the RGB which i thought originally was monochromatic representation of the AFM images) there is very little difference in the way the molecule gets measured. THis is comforting. Means, SD, and t tests indicate that not much changes in terms of measurements of the length of the dodecamer arms using different algorithms for color to grayscale.
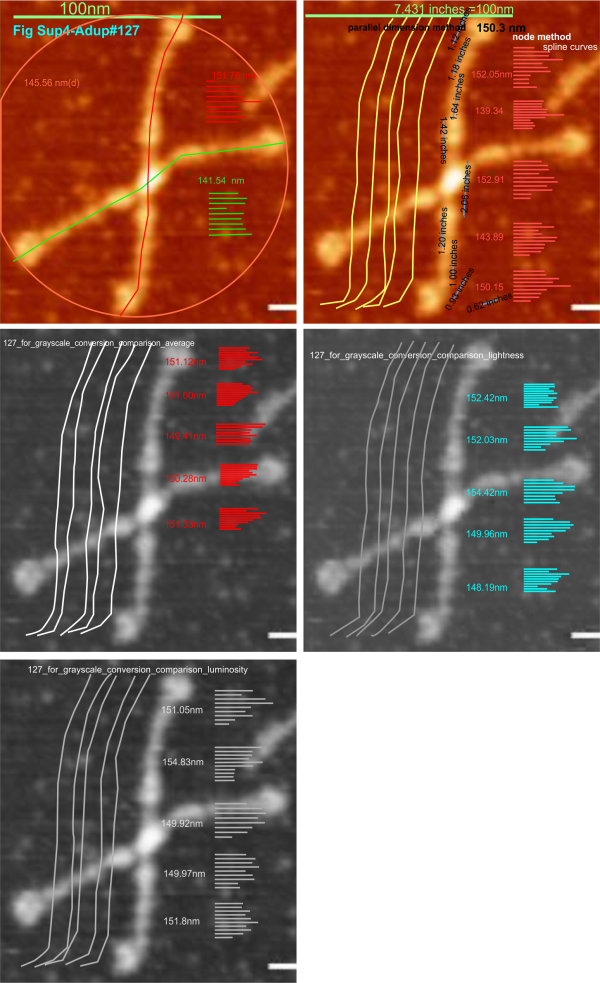
Image above is one from the publication of Arroyo et al that i have quoted literally hundreds of times, and have designated #127 (and appears also in the Supplement Figure 4 of their publication). I chose the longest arm of this particular dodecamer to determine if the length of the arm changes with manipulation of the image. This longer arm is about 14nm longer than the average found by measuring over 150 hexamers indepently. (see previous posts). Upper left, the original data (diameter, and each arm measured separately), upper right, duplicate to see if there is significant variation in the way i create the spline curve to measure, and also a measurement of the segmented line using the parallel dimension tool (neither/either works as well, the former is easier to record individual line lengths so that is what i use). Then middle left middle right and lower left are grayscale conversions using “average” “lightness” and “luminosity” algorithms. THe length was measure 5 times independently in each case. Clearly, too little (and using t-test found not to be significant different from the color, and among the grayscale images) variation was found to warrant more data.
That said. I will test these same five images for differences in the LUT plot “peaks”. I do anticipate differences in peak height and peak width BUT, not in the NUMBER of peaks along each arm. Background peak height will be found for each image separately as well. We will see.
A sense of humor
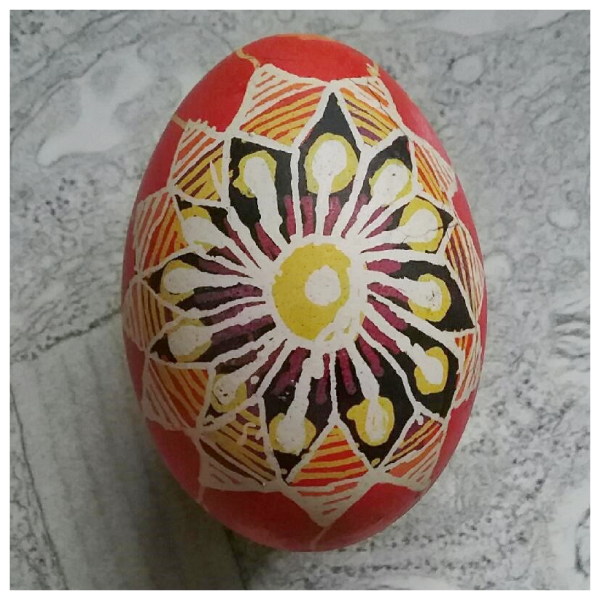
If one doesn’t have a sense of humor in science, its really dull and frustrating. So, here unequivocally is an SP-D multimer made as pysanky easter egg in the 1980s sometime by one of my son’s. Just had to laugh at this multimer repleat with carbohydrate recognition domains (about 12 of them – so very much in line with the concept that SP-D multimers are made up of dodecamers), and also visible is the N termini conjunction in the center. Just had to post, how funny to me. If one doesn’t care that the first peak on either side of the N termini is a little bit too far from the center, one could just say, and there are those glycosylation sites he put in as well.
Ways to measure segmented lines
Ways to measure segmented lines are varied. Here are two which produce nearly identical results. 1: break nodes, rotate to horizontal and 2: use the parallel dimension tool (in CorelDRAW). Using both, either, was very very close, therefore the method (1) which is easiest to document visually is the one i will (have) used will continue to be the preferred method for measuring the length o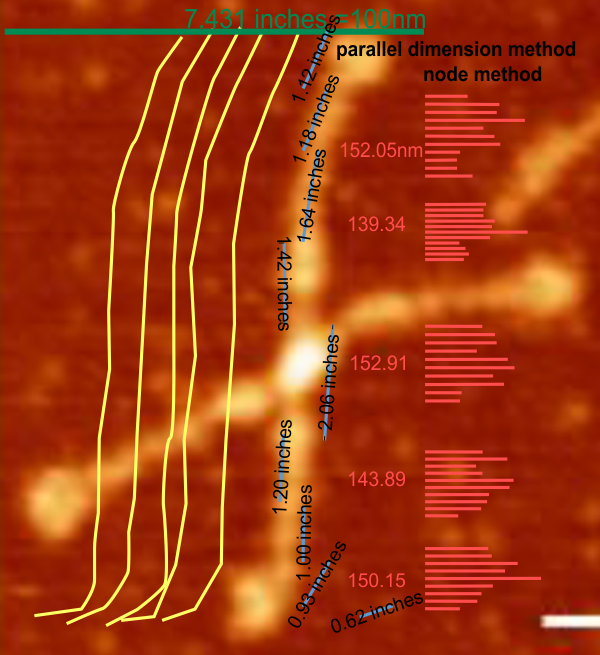 f SP-D hexamer-arms.
Why no uniformity in colors ascribed to amino acids
Why no uniformity in colors ascribed to amino acids? This cant be rocket science. There should be a way to pick some attribute, for example, branch chain, and have an array of colors from most to least, then with a selection, large to small, and then basic to acid, etc with hydrophobic to hydrophilic.
Then why not combine two attributes with a color between those two colors. Its not like we have a paucity of colors available, and you can be sure the RGB scale could provide one with plenty of blended choices – but not this chaos.

So, new topic,what is the best way (there will be as many variations here as for color (maybe without quite so many tones as colors (well that probably isn’t going to be true, since tonal perception is not as substantial as visual perception of color –haha)at least that is my opinion as someone who has studied music for decade).
Height measures, hand drawn height, LUT plots
In an attempt to find whether there are predictable peaks along the collagen like domain of SP-D arms two different types of AFM images (Arroyo et al mentioned amplitude modulation mode) I measured (in the supplemental figures 2 and 4). Plots using FIJI (Image2, ImageJ, all three versions seem to perform similarly) in these two comparisons show three distinct and one not so distinct peaks in the collagen like domain. Pink dotted rectangles show peak valleys that seem to correspond between the height image with hand drawn line (top part of the figure), and the flat image with LUT plots drawn from a node-cusp line drawn on the grayscale (converted from image in middle) (middle and bottom part of my composite figure). N termini (left brightest portion of the dodecamer, CRD on the right. 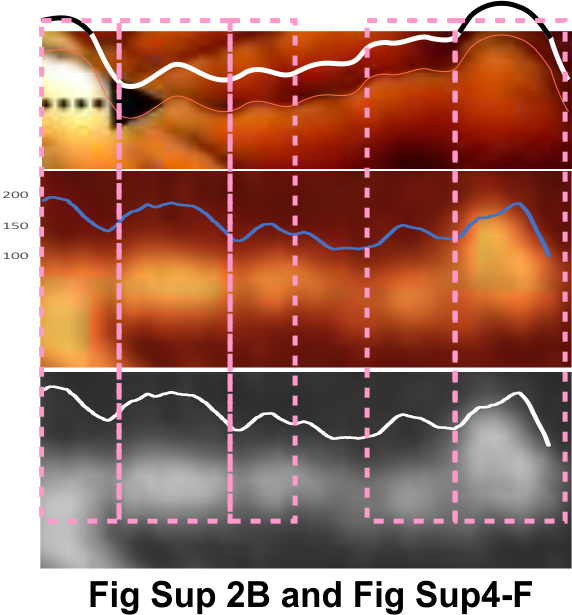
Science illustrations fun reminders: coronavirus charms, patterns for cross stitch, fridge magnets
Science illustrations fun reminders: coronavirus charms, patterns for cross stitch, fridge magnets — all made with some accuracy for the real SARS Cov 2 anatomy in mind. This has been an education for me, firstly in modeling proteins on RCSB and the pluses and lacks theirin, also for learning a little about virology, even more importantly, for releasing that pent up emotion over this crisis, having to work from home – which has its own problems and rewards and not knowing whether the crisis politically drive, fear driven, whether this approach is good for society and the economy or bad for society and the economy, which leaders are telling facts which are telling fiction, and knowing the final impact will only be known in the passage of time).
BUT – here are some fun (at least fun for me) products of these last two months (made without apology and without fear).
|
||
|
|
|
|
|
|
|
|
|
|
|
|
|
|
|