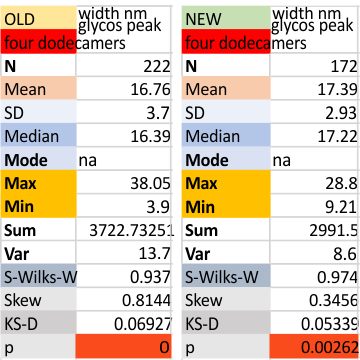
Two different datasets (gathered with the same process, but just different plots) look so similar that it seems likely that this 16nm value for the width of the glycosylation peak will be appropriate for the training plots to examine the other 80 dodecamers of SP-D for which i have pictures.  The valus for all plots together (not divided into the four dodecamers) for old and new datasets below. Please note that the red box at the bottom is an indication of deviation from a normal distribution of the dataset, this shows a significant skew which appears because of the variations in the way signal processing programs divide up the plot into peaks, and how I arrange the peaks into a number (15) that was determined by those same image and signal processing algorithms.