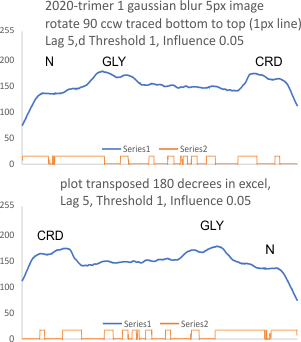
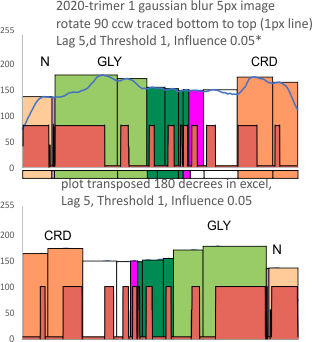
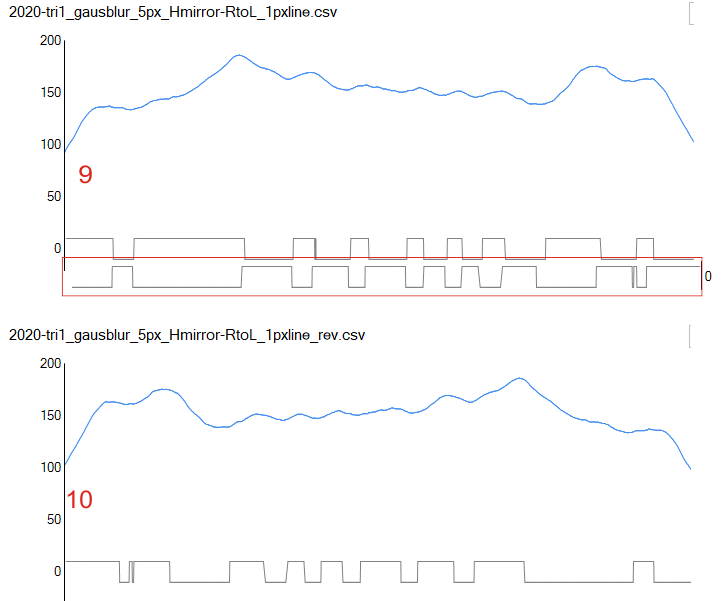
I am not sure why the transposed excel column (first line becomes last line) was plotted like this in the stackoverflow app for peak finding. ? The rows were mirrored vertically in excel, but i didn’t expect the peak widths to be mirrored when i plotted the transposed data into the stackoverflow peak finding app. (see red box below the original excel plot. I cut ans pasted the bottom part of the reversed rows just below the peak detecting series in the top plot (RED BOX). something very un”right” here. Suggestions are welcome.
It seems to me that the height of the tallest glycosylation peak when plotted at the end of the tracing influences the detection of the smaller N term peak on the trimer. Plotting a trimer within a dodecamer (which makes the N term peak about the tallest peak on the tracing, there is the possibility that after passing that peak the influence on the detection of the tiny peak and glycosylation peak has changed. I think looking at the left and right trimers in a dodecamer this could be uncovered. I actually think i did that early on. So on the plot reversed, peak width and height of the glycosylation peak influences the rest of the tracing.
Using 8 similarly collected tracings 1px thick line and 5px thick line plotted in ImageJ, of SP-D, with images mirrorred and rotated, then peaks counted in the LagThresholdInfluence mode from stackoverflow, the mean peak count in a this particular trimer is 10.5, all values appear twice, no mode, however if the forward tracings (that is from N to CRD, peak number is counted it is 10 (min=9 max=12), while if the reversed data is plotted the mean is 10.75 (min=10 max=12) maybe not an important difference.
This is an assessment of a single peak finding funcion….in addition I have used Octave’s iPeakM80, and AFPPxy, Scipy Peak Finding, PeakValleyDetectionTemplate.xlsx, and my own two non-signal processed assessments, one from the image itself, the other from the plot generated by ImageJ (that plot used by all other functions).
I compared the use of a five px line to trace the moleule, and a 1 px line. I am revisiting that choice but it seems that the 1 px line works fine.
RCSB (as of march 2 2024) still doest not give a full structure for a surfactant protein D trimer (nor did i see hexamers, dodecamers). This means to me that the collagen like domain and the N term junctions are still not really known, in terms of 3D structure…. thus, as has been for years, when one looks up SP-D they just see the neck domain and the CRD domains…