Monthly Archives: April 2024

Using functions (Octave (iPeak, autofindpeaks), excel templates, Python/scipy, and Github/Z-score)

Using functions (Octave (iPeak, autofindpeaks), excel templates, Python/scipy, and Github/Z-score) sometimes just find more, or miss peaks that any human would detect. Choosing a single function for any of these programs as a standard doesnt give very pleasing results, but on the other hand, adjusting them for every single different plot, is bias…. SO what is the answer,  — training?, how is training AI better than training a real live sentient viewer? The options are– accepting the vastly disparate peak numbers with a fixed functions, or to find something sensible, or just using one’s well trained eye.

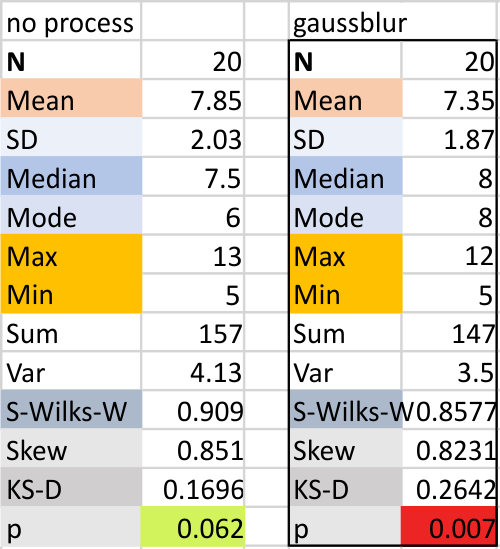
One easy observation is that using a gaussian blur reduces the number of peaks plotted, per the increase in peak number when “no processed” images that are pixelated causes the number of peaks to be higher.  It is clear that the best images are high res and require no image processing filters, but the reality is that not all images are great.

to pixel gaussian blur AFM image of SP-D trimer
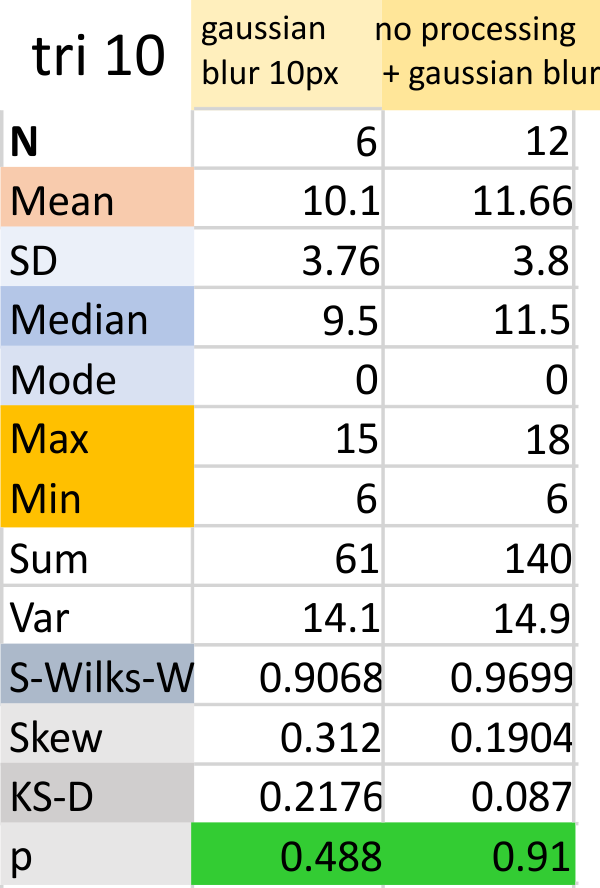
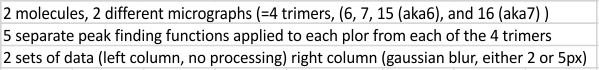
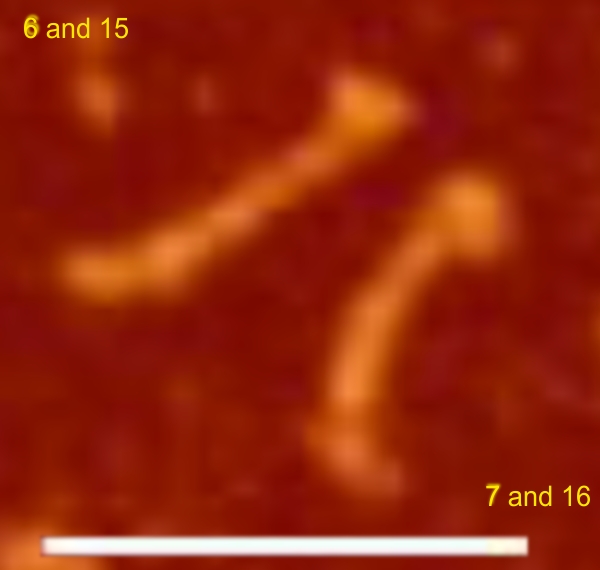
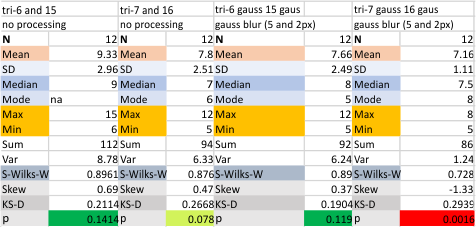
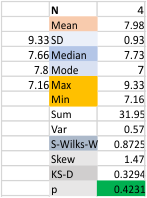
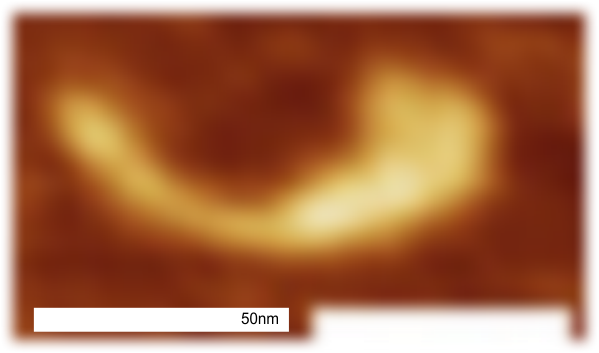
Above image is easly read as 7 peaks (minimum) (at least to me), but the range of peaks when using the programs and functions all along in the “peak finding for SP-D” blog that I have posted, has far too big an SD (again in my opinion). (7,11,14,6,8,15 is gaussian blur 10 px, and the latter plus the no processing (hence pixelated image) is 9,17,18,10,12,13. Data together is in the right hand column, gaussian blur is data in left hand column.

Two SP-D molecules, two different published images, two different image processing programs, 6 different signal processing functions (continued)

Two SP-D molecules, two different published images, two different image processing programs, 6 different signal processing functions (continued). Using only the peak finding functions (from the various programs listed in previous blog posts), one or two tailed t-test say there is not a significant difference in the number of peaks found between the “no processing” set, and the “gaussian blur” set of plots.  Column on left is no processing, column on right is gaussian blur.


Specifics of the plots used in the analysis above is given below.  Trimers are the same ones picture in the previous blog.  This set of data has NO counts made by me from the image, only counts made from the plots made in ImageJ then subjected to various peak finding programs. The molecules represent a pair, which were in two different images, and at two different resolutions.  No difference in the process was found between these two sets.

The total number of peaks is a little bit shy of what of what i think they should be (that is,  N=8 peaks) but the comparison here is one to see what impact the original image has on peak counting outcome.

Two SP-D molecules, two different published images, two different image processing programs, 6 different signal processing functions

Two SP-D molecules, two different published images, two different image processing programs, 6 different signal processing functions — an attempt to see whether apps and image resolution cause huge differences in brightness peak determination using tracings through the middle of an AFM image, traced from N to CRD (in that direction, left to right, 1px line using ImageJ).

The summary below does not distinguish between signal processing apps…. the 6 different peak finding apps are summed into one value with the image processing filters. There is an N of 4 (two molecules, one set, trimers, 6, 7, 15, 16 with  no processing, and one set (the same 2 molecules filtered with a gaussian blur (trimer 6 and 7, gaussian blur 5px — trimer 15 and 16 gaussian blur 2px). The no processing image was lower resolution, the second set was an image at higher resolution.  Both sets were plotted for brightness peaks.

The two trimers are seen below.  A total of 48 peak finding plots, 6 plots each trimer with no-processing, 6 plots each trimer with gaussian blur filtering.  Trimer 6 and 15 are the same molecule, different images, as are trimers 7 and 16 the same molecule, different images.

In the summary below, data for the same molecule  were combined (6, and higher res duplicate 15)( 7 and higher res duplicate aka 16). Two categories of image processing (no processing, and gaussian blur) were applied.  Both molecules traced with “no processing” showed higher peak numbers (likely due to greater pixelation of the images. Gaussian blur even when sparingly applied decreased peak number.

However the mean of the group (7.98) is supports the idea that there are 8 peaks per trimer. This is what has been seen consistently using all 6 signal processing functions (all at the same settings) for peak finding.