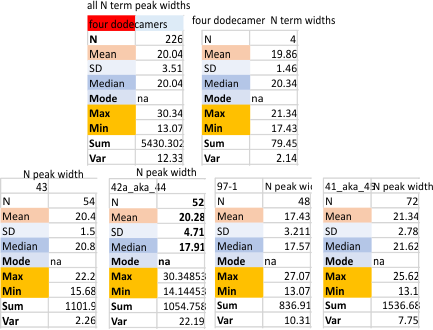
Summary of peak widths (valley to valley) using image processing as well as five signal processing programs to calculate that dimension. In one sense the results are really good, in another sense they are basically so similar to those just done by “my minds eye and a good measuring stick” that the two years has provided no new information. 20 nm is a very stable number for the valley to valley measurement of the N termini junction of surfactant protein D as is shown in AFM image. This value is found as all trimers with the full N term peak, as for each of the individual molecules that have been measured (in this case my numbers for them are arbitrary: 41_aka_45; 42a_aka_44; 43; and 97-1) and also the mean of the four dodecamers (N=4) . The number of trimers measured in one molecule was greater than the other three so this data set was primarily made only those plots which have similar processing. That is with 1: images with no processing, 2: images with a gaussian blur (either 5 or 10px); images that have a gaussian blur and a limitrange filter. 3: each of those images from each of those groups of image processing were then exposed to signal processing by five different algorithms (as part of several programs: Octave (Autofindpeaks.m, and iPeak.m; Scipy; LagThresholdInfluence (batch processing) and an excel template for Peakand ValleyDetectionTemplate.xlsx). Therefore the balance of bias was similar among the four images of SP-D.
 The tiny peaks on either side near the valley of the N term peak are located by image and by a combination of image and signal processing algorithms only about 31% of the time. This is a little disappointing, but hand counting the peaks provides a more robust counting of those tiny but very consistently found peaks.
The number of peaks WITHIN the N term peak varies from 1-2 typically. About 50% of the N term peaks consist of two identifiable sub-peaks. The widths of the sub-peaks is not always equal and depends upon how the segmented line is drawn through the image.

Width of the peaks is about 3nm wide, which still can be identified within the micrographs very often. In this set there is one value which is large, skewing the data. 
I calculated that single image without the large value below.
 Here is the information (peak width in nm of the tiny peak) from months and months ago, which literally has not changed with the addition of the signal processing assessments. I dont know whether to be happy this didn’t change, or be miffed because of the amount of time to confirm that the original assessment was pretty good. Tiny peaks appear about 30% of the time (rather are measured as “peaks” by the five signal processing and one image processing plots about 30% of the time. There are many times that tiny peaks are visible, just are not counted.
)