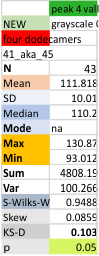
The peak just lateral (remember going to the right and the left of the N term peak with peak 1 being counted as the center N term peak), peak 4 is a very consistent finding with image and signal processing. You can see top image shows that only once in 172 plots of trimers was there no detection of peak 4. Means and other data are shown both ways. The image just below that is the mean grayscale valley value for peak 4, calculated as an N of the number of dodecamers examined, and the N of plots is not the same in the dodecamers, but each dodecamer is given the same weight in those means and SD. With and without the single missing value in one dodecamer, means are very close, that is grayscale value of 112. The third image down shows the mean grayscale value for the peak 4 valley for each of the four dodecamers individually (these were used for the means shown in the second image from the top). Lastly the single dodecamer where a single peak 4 was missing is shown at very bottom).