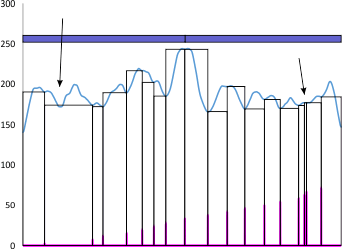
 This is an example of why i get frustrated with peak detection apps…. vertical axis is grayscake 0-255, x axis not numbered is nm (which I have to calculate against a bar marker on the original micrograph) and is not really relevant here.
Peaks that are found are clearly marked at the point of valleys on each side, by the program (it is an excel program called PeakValleyDetectionTemplate.xls) and what this smooth function (smooth 11) thinks is a valley is highlighted in pink…. so i didn’t miss anything…. or add anything.
My draw program has a “snap too” function that snaps to the valley lines detected so I don’t even make the judgements in identifying those vertical valley indicator lines there so this program measures width between peaks with the lines (which I colored pink) and are easy to follow. BUT…
My ADDED arrow on the left points to a peak that I certainly would have called a peak that was not detected by this app, my added arrow on right points to a peak that I certainly would NOT have called a peak which this app thought was a peak (I could not even find a drop in grayscale of one single pixel).
Just out of wanting to know the facts in this study of SP-D, and trying to help determine the structure of the common multimer of SP-D (the dodecamer), I dont change those chosen valleys from the apps, I just report the results whether I agree with them or not. But sometimes these apps “think” (lol) too hard about lag, threshold, smooth, incidence, width, deviation, and influence etc…. and gloss over the obvious, not able to consider chance, inherent variability, possible radial and bilateral symmetry etc……..therefore at this point they are really not as good (in the method that I am using them) as human judgement (mainly mine ha ha ha) in my humble opinion. I also accept that this is a simple molecule, bilateral, with maybe 11-17 peaks routinely found. So its not a massive chaotic mess, but sometimes they just dont work.