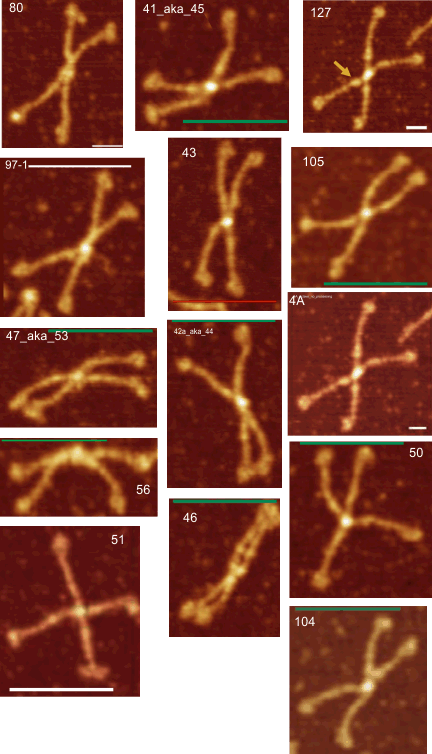
14 dodecamers of SP-D: Width in nm of all peaks. Image below is a thumbnail of each of the SP-D dodecamers used in this analysis (number designation are my own, but bar markers for calculating magnification come from the original publication(s)(Arroyo et al). All AFM images used (fir the data below) are rhSP-D. Dodecamers labeled 127 and 4A are the same molecule from obtained from different figures within the publication (deliberately used for comparison measures) all others SP-D molecules are unique.
The total number of peaks (traced using the segmented line option in ImageJ) has been shown many times to be just over 15 peaks per hexamer of SP-D. And the segregation of the various peaks plotted in ImageJ into a 15 peak-category has been largely influenced by my own 1) general assessment of the general shape of the plots, peaks and sub-peaks, and 2) the obvious mirror symmetry of the hexamers (and trimers) of SP-D.
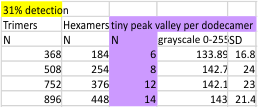
 Total number of trimers measured is 896 (14 dodecamers, with many processing apps and image filters). Trimer measurements include the entire N term domain peak in each, and hexamer measurements include each peak appearing from CRD to CRD. Data could be adjusted somewhat if the arm of each trimer in a hexamer were normalized to a known distance in nm from a center point in the N term domain peak. This has not been done yet in these data.
Mean peak width is based on plots made in ImageJ, of images subjected to various image processing and peak counting apps. Summary of progressive analyses (6, 8, 12 and now 14) shows that little has changed since the first measurements. At this point most of the data is derived from signal processing functions (5 signal processing functions vs my 1 set of counts from the images), and while these are purported by some to be unbiased, it must be recognized that I choose the function settings that I think best fit the image. Largely, the signal processing is “similary biased” to image processing filters and personal observations. Graphics below show the mean peak width in nm +/SD for each progressive analysis. Peak % detection rates for all peaks is found here) or mentioned below.


I have added this “iffy” peak data (mint green below) because I really do think it exists sometimes. It exists as a detectable depression or division within the center of the N term junction of just 3 of the 14 the dodecamers (a mere 15 times out of 896 plots) by the signal processing functions, but I see it more often than that. I find a similar low detection rate by signal processing functions for the tiny peak on the downslope of the N term junction peak (which i call “tiny” peak). Sorting the data by my assessment and all other assessments should point this out (future project).
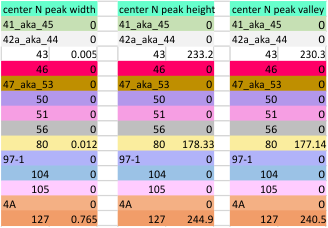
While I also have observed what looks to be side to side attachment of N term domains in hexamers, most frequently the N term peaks looks to be an end to end attachment — where sometimes there is a decrease in grayscale values (peak height)(thus forming two peaks). How often this is detected by the ImageJ plots is very much dependent upon how I trace the line within the center (lengthwise) of the hexamer. In multimers of SP-D, the center N term peak depression is very often pronounced. Data below show it is infrequent, and narrow in width, as a very shallow depression at the tope of the N term peak.
How much the presence of this peak in the center of the N term peak influences the total peak number is probably minimal.
 The height and valleys of peaks in the plots of SP-D dodecamers is a measure of grayscale (0-255). THese values are determined by ImageJ for each of the plot lines (two lines plotted per dodecamer, from one CRD of one hexamer to the CRD at the other end) of the images, unprocessed, or processed by a range of filters in a range of programs (link to the exhaustive list of filters and functions tried). Five signal processing functions and two filters were used most commonly and were selected for the output which most resembled what I saw in the images).
Peak height of the N term junction peak (central in the hexamer) data from four different summar datasets. The bottom row is an update and inclusive of the top three rows (as is true for data above). The data with the yellow columns are the means and SD ONLY for detected peaks, white columns are for all data for that group. Actually it is nice that peak from 14 molecules plotted with many variations show similar outcomes. 


The mid N peak width is so tiny as to not maybe be worth making a graph for. I will decide.
Peak valleys for each of the 15 peaks per hexamer.


 The image below is just of the very rare center blip in the N term peak which i have often mentioned as being prominent in the multimers greater than the dodecamer. This peak is detected in only 3 of the 14 images, and peak width (in nm) and peak height and valley (grayscale 0-255) are shown here.
