Using functions (Octave (iPeak, autofindpeaks), excel templates, Python/scipy, and Github/Z-score) sometimes just find more, or miss peaks that any human would detect. Choosing a single function for any of these programs as a standard doesnt give very pleasing results, but on the other hand, adjusting them for every single different plot, is bias…. SO what is the answer, — training?, how is training AI better than training a real live sentient viewer? The options are– accepting the vastly disparate peak numbers with a fixed functions, or to find something sensible, or just using one’s well trained eye.
One easy observation is that using a gaussian blur reduces the number of peaks plotted, per the increase in peak number when “no processed” images that are pixelated causes the number of peaks to be higher. It is clear that the best images are high res and require no image processing filters, but the reality is that not all images are great.
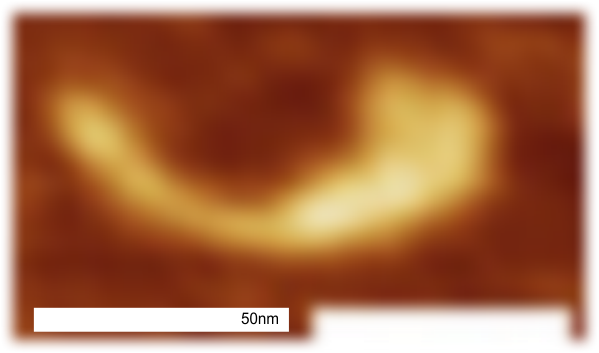
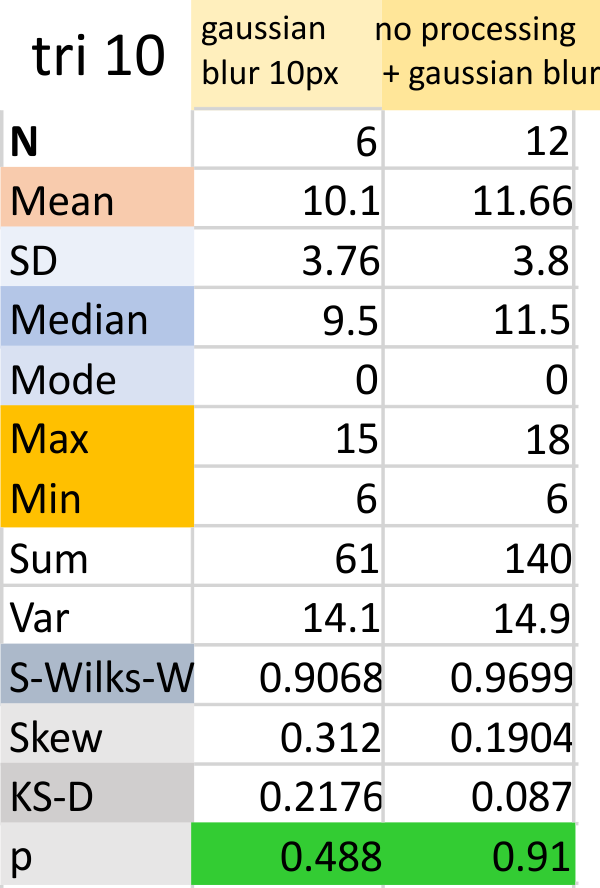
 Above image is easly read as 7 peaks (minimum) (at least to me), but the range of peaks when using the programs and functions all along in the “peak finding for SP-D” blog that I have posted, has far too big an SD (again in my opinion). (7,11,14,6,8,15 is gaussian blur 10 px, and the latter plus the no processing (hence pixelated image) is 9,17,18,10,12,13. Data together is in the right hand column, gaussian blur is data in left hand column.