I have been trying to find a app for finding peaks that does not depend upon previous peak height and width to influence the peaks following, and the peaks prior to extremely large peaks. I have also tried to find such a app that “understands” symmetry.
What I would like is one that has 0 “influence” and 0 “width” parameters. I find peaks consistently that are very small, and always in a similar place (which for two or more years I have named the “tiny” peak, that lies in the valley between the N term peak and the glycosylation peak(s) of surfactant protein D. I have rarely found that the peak finding apps (this includes scipy, octave, excel templates, stackoverflow) find those peaks with any regularity, in spite of the fact that they very often find “peaks” that I would never assume would be a peak.
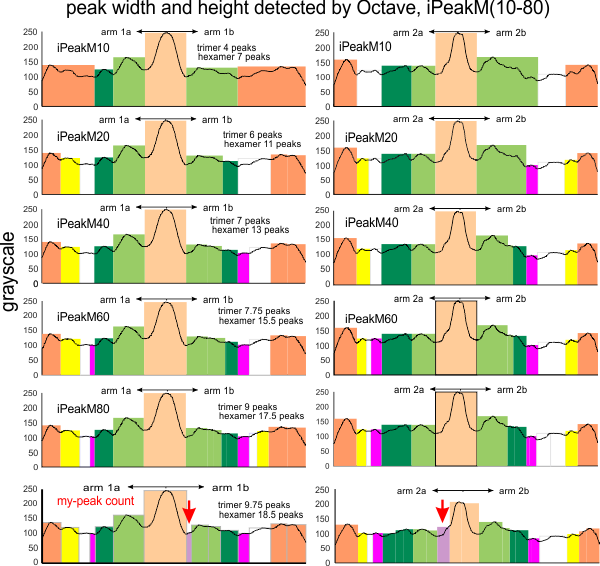
I have used the same .csv file of two plots (each a hexamer, thus two trimers) of a dodecamer of surfactant protein D and applied several iterations of Octave iPeakM. The counts below are for peaks per trimer (the N term is included in each trimer though it is a central peak in this molecule, and is included in the count only once in each hexamer). (as an aside, it is interesting that this central N term peak often has divisions, as is seen in one plot, but not the other).
Peak widths for all the Octave plots are determine without my influence. The most botton plot, is MY ORIGINAL PLOT, from before I ever started using Octave or any other peak finding app. Thus something between iPeakM60-80 was/is the best (but not perfect) match for my own findings. Coloration of the peaks is done for the sake of observing obvious symmetry, the N term peak (peach) the glycosylation peaks (light green) and the CRD peaks (orange) are known (and reported peaks). Four additional peaks are consistently found per trimer. Five additional peaks (total of 8, counting the N term in a trimer) in each trimer is the typical number of peaks found. (that data obtained from almost 1000 plots of trimers previously).