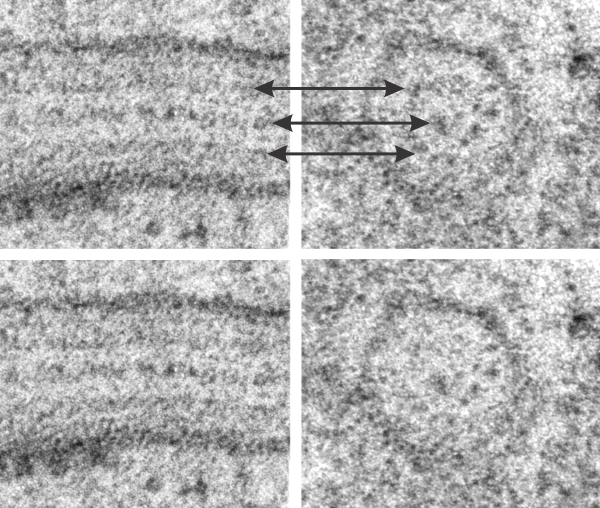
From the same micrograph here are two tiny sections of the larger image which represent a well demarcated cross section (on the right) and a longitudinal section (on the left) where the organization of this protein is parallel to the RER membrane. The banding in each is evident, however the bottom pair of images is “as is” and the top pair i have used the “burn” tool in photoshop to highlight where in the cross section the bands that match those in the longitudinal section batch up, and have added arrows as well. One arrow to the central dot (which corresponds to the inner more dense band, presumably where the carbohydrate recognition domains in the trimer (or octadecamer) lie, and to the lighter band which may correspond to the N terminal regions. It is my opinion that the N terminal groupings of the octadecamer come together in the highly periodic, but lighter bands, mirrored in the longitudinal section.
It is not clear how the inner CRDs fit into the central dot of the cross section… particularly since the cross section is about 100 nm in diameter. Picture on left has three or four ribosomes to compare size (somewhere between 20-30 nm diameter) picture on right has one ribosome to compare. Both are identical magnifications and imaging treatments.