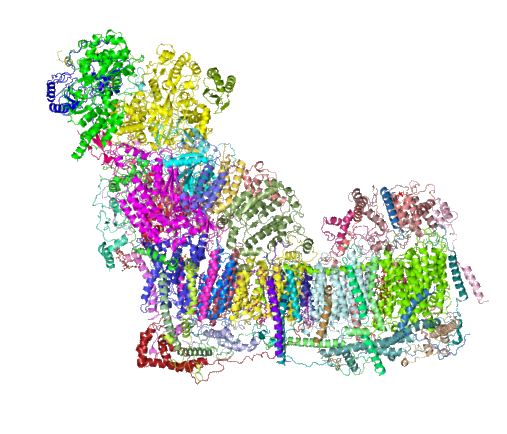
Aside from the fact that the word “structure” has been usurped by the molecular biologists from the microscopists, both show structure. The new puzzle is to fit the two together. I personally know nothing about protein structure but know a little bit about cell structure… so the deal is to find where the two can become one. This of course is now accomplished by computational microscopy and better resolution, none of the equipment or funds for me to play with, BUT i still enjoy finding what is available online and working to understand that about which I am curious.
Beginning with the paracrystalline proteins in some mitochondrial disease states it became a puzzle to try to solve: that is, what proteins are making this brick-like inclusion in the matrix of mitochondria (see previous posts).
Just beginning with — Complex I (NADH:ubiquinone oxidoreductase) critical to energy metabolism in mammalian mitochondria on the inner mitochondrial membrane I used RCSB PDB to play with the purely “visual” issues of the protein. First diagram below…. shows a band in the transmembrane portion which by my eye is quite different than the rest of the structure in terms of color – and therefore leans toward hydrophobicity (according to the coloration charts of RCSB PDB). This model (which is to be taken “generically” of the NADH ubiquinone oxidoreductase I have shown on as a view from the nominal R and L (the bumby lump (arrow with no text) which I am assuming from the pale color is neither hydrophobic nor hydrophilic? just above the intramembrane “box” on the L). I doubt there is a “right or left” but for descriptive purposes, the front back – right left has been shown because they are so different, except for the transmembrane portion which is clearly a band that goes through and through. The inner mitochondrial membrane is from a diagram I did earlier… but gives a suggestion of the orientation of the NADH ubiquinone oxidoreductase that i have found for this in other diagrams online.
So now to add some other diagrams which give more fun images. This one, oriented identically to that one above, shows alpha helix area (bright pink–also according to the charts of the RCSB PDB viewer guide) that is within the bounds of the inner mitochondrial membrane. When one rotates the ribbon molecule, they are all neatly aligned perpendicular to the length of the membrane. I have to assume that they fit within the lipid realm of the trilaminar membrane.
Here is an edit to fit the group and an electron micrograph. Ha ha… probably too big…I will have to google the size of the molecule relative to the 3-5 nm thickness of the trilaminar membrane. 
 within the band of the mitochondrial membrane it is easy to see a change in aminoacids by the increase in grey coloring in that area. This model is by element, the amino acids in the central region are mostly isoleucine, leucine, proline, and phenylalanine which RCSB has colored with very close shades of grey, hence the slighly more grey look to the transmembrane part of this molecule.
And the ribbon molecule emphasizes the vertical order in the transmembrane band…. I know there isn’t really anyone out there who doesn’t already know this, but the visualization here really makes it so apparent. Sheep – entire respiratory chain complex 1 ribbon diagram from a different database.  .
.
and Cryo-EM structure of human respiratory supercomplex I1III2IV1

