Category Archives: Mitochondria: electron microscopy

odd mitochondira, great mitochondria, electron microscopy and ultrastructural details

Using a distance and area tool ONLINE to measure inter-ribosomal distance on RER

Using a distance and area tool ONLINE to measure inter-ribosomal distance on RER was kind of interesting… There was a freebee trial of 24 hours on this one package called SketchandCalc.com which was in one sense much easier to begin with than ImageJ and L-Measure… neither of which I was able to get data from within the first hour or so. The former unfortunately does not take tif files, or pds so that is a little annoying, but it did import an 8 meg electron micrograph.
It is not intuitive in terms of setting a “denomination” for (for instance) nm, somewhere the measurement got lost? so all measures here are “relative” to my measurement of the diameter of a ribosome (well actually a mean of several ribosomes and I assumed that a mammalian ribosome was 27nm in diameter.
The whole point of making this test was to find the easiest software (shortest learning curve) to make two simple measurements, that is perimeter (and/or distance) and area from my micrographs. I am not happy with the price for the online software since this is a research project and i gain absolutely nothing from it in a personal way, it is not a business venture.

Truth be told i called a local computer repair place (been around for decades) if they might have an old Summagraphics tablet like i used back in the “day” LOL. The owner just laughed.

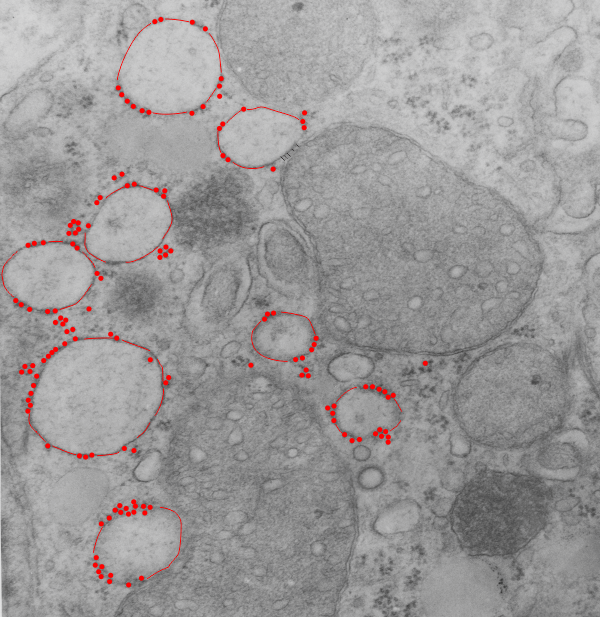
So here is the micrograph, and the measures are of the distance between the attached ribosomes… BETWEEN, because the spacing seemed in to be somewhat regular and I wondered whether there was any biological importance to that. At the same time i took the opportunity to measure several points at a mitochondrial-RER membrane close encounter.

10,000,000 in some cells x couple billion actively synthesizing cells = a whole lot of ribosomes.

Top micrograph (18406_78375_50d_wc-ii no NAC) shows dilated RER (a combo RER-SER with interestingly spaced translocase (?) attachment sites. There are other characteristics too, the length of the string of ribosomes. Red dots are ribosomes (on micrograph below); distance between attached ribosome strings is about 273.6nm +/- 27, n=30, so the SEM is 10%, that is not really that bad for biology and there might be something to this; perimeter of RER vesicles= is about 1500nm, n=10; mean area is about 1600nm2

Certifiable? or does rRNA on RER rock

I was looking at liver electron micrographs, looking for mitochondria, trying to see whether cristae juntions are such a noticeable feature as is claimed, boy I can not find them easily. But in “boredom” not really boredom, more frustration, I decided to punch in a “kick” beat to the spacing of ribosomes along the RER membrane.  I hope this fun time with Fruity Loops doesn’t distract me from doing real science…. as I can see how fun it would be to use a top hat, steel drums, cymbals, for some ribosomes a little further away, and a base beat for those that are very clear and a blip for those that are faded out and then play two tracks together (opposite sides of the ER membrane being a separate track each). Now you know why I chose the title for this post “certifiable” (i am not crazy, as sheldon cooper says, my mother had me tested),

Ultrastructure of some mitochondria and RER associations

It is really likely that some of the patterns in electron micrographs (even though they were taken decades ago) can still reveal some of the unique ultrastructural architecture that cells possess, even new and useful data. (This is an apologetic of sorts, since I don’t have the latest in tomographic equipment or a wet lab but still find amazing structures in the old TEMs i have lying around.) So these images are offshoots of a previous post on mitochondrial substructure, and I noticed two new things in this same micrograph. That is:

1) that one of the mRNA and ribosomal spirals has a dense center and from it radiate spokes (red arrow in left and top middle images) and…

2) there is a portion of mitochondrial matrix? intra cristae? area which is clearly organized into repeating parallel layers with central dots.  (this is best seen in the images to the far right. The boundary between mitochondrion and RER is black dotted line, lower images on right; black box on left is area enlarged (top and bottom middle) one with contrast enhanced (bottom) and one set of mRNA+ribosomes spiral, and black line marking line likely mRNA, and to the left at the red dots a vertically oriented multilayered organization of mitochondrial (membrane?) cristae…  the black box surrounding this particular area of interest denotes the two images to the most right.  There is no question about the organization of vertical-parallel lines, and dots.  These are the blue dots in the two lower right hand figures. Vertical lines with vertical organization of the rounded densities is quite striking (upper right). This is mouse liver, neg 6118, block 5220 and from my notes it received tween and PP5 at 50mg/kg and this is a 72 hours necropsy. Right top is same as right bottom, where the central dense dots and outer dense line – substructure is observed.

Mitochondrial interactions with RER

Hepatocyte here, GCLC ko mouse, shows the donut and irregular configuration that is common in circumstances where mitochondria are stressed (I personally have seen it several times but in unrelated experimental circumstances so it is probably a generic response mostly).  In this really opportune section one can see a mitochondrion (with an odd donut shape) ont eh left, and a section of RER which has been sectioned tangentially showing the closeness and absolute regularity of the ribosomes along a spiral of mRNA.

I bet at some point all information about these association and the proteins (i saw a list that mentioned in the 800s and counting) in the inner and outer and cristae membranes, and the cristae junctions as well as the matrix will be modeled.  Until then, circumstantial evidence for the power of the interactions between mitochondria and other organelles (and cytoskeletal proteins) has to suffice.

The ribosome spirals here look to have approximately 7.3+/- .47 (SEM) ribosomes per spiral, n=9 (a small sample but the best orientation, and a single micrograph…. so this is just a suggested number obviously.  19735_73218_#201 liver alb+/- Gckc -/- postnatal day 28. liver mouse, no NAC.

One thing abou these mice that is pneumonic is the dilated ER, a mix of smooth and rough, ribosomes spaced and the presence of the little bubble-blip invaginations of ER within the outer RER membranes.  These mitochondria also display fission lines and tubular cristae, and quite a bit of it.  Blue dotted line (outline of one part of a mitochondrion – that one tangentially sectioned beside the RER, white box, area for enlargement to the right. Upper image on right has cytoplasmic ribosomes in mRNA-spirals (orange) and lower image is contrast enhanced to highlight the spirals of cytoplasmic ribosomes.  I really don’t think there are any good examples of mitoribosomes in either of the two mitochondria shown here.

Numerous proteins in the outer mitochondrial membrane (encoded by nuclear DNA) target and or are attached to cytoplasmic ribosomes. Cytoplasmic ribosomes have been visualized on mitochondria membranes (that would be the cytoplasmic face of the OMM). These are suggested to be linked by the translocase of the (outer) mitochondrial membrane (TOM) and it is reported that the ribosomes are in clusters (Till Klecker et al, 2014 Trends in Cell Biology) and that pretty much looks like these nRNA-ribosomal spirals… tidily wound.

MDVs, mitochondrially derived vesicles (about 70-150nm) are  purposeful buds of membrane derived from mitochondria which are targeted to lysosomes, and maybe other organelles.

Just an “aside” here, but is it possible that the donut shaped mitochondria (invaginations, and extra turns and indents) might be somehow a deliberate attempt to increase surface area for interaction with other membranes.   Another question is the orientation of cristae.  I have looked for cristae pores, and that relationship…  just not seeing it overtly.

Identifying and diagramming mitochondrial proteins

This group did, in my opinion, a reasonably good job of modeling mitochondrial membrane proteins in a way that utilizes all the information (likely) available.  I would like to be able to do such for all known mitochondrial membrane proteins, or even the whole mitochondrion… matrix proteins as well, but lack the skill and knowledge (working on the latter) to do so at this time.  I would have made only one adjustment, and that would be to have depicted the inner and outer mitochondrial membranes as actual molecular structures as well. It is still possible to detect the areas the transmembrane areas in some of the molecules.  It is a little confusing to have the outer mitochodrial membrane as a stiff line, as we know it curves with, sometimes closely to (as at the pores) and other times further apart, and the difference in the curvature of the inner mitochondrial membrane is sort of cumbersome and doesn’t flow through the transmembrane domains comfortably.  But a great depiction, none-the-less.

Here is their citation: Medlock, Amy & T Shiferaw, Mesafint & Marcero, Jason & Vashisht, Ajay & Wohlschlegel, James & Phillips, John & Dailey, Harry. (2015). Identification of the Mitochondrial Heme Metabolism Complex. PloS one. 10. e0135896. 10.1371/journal.pone.0135896.

Human mitochondrial acetoacetyl-CoA thiolase

Human mitochondrial acetoacetyl-CoA thiolase: (found on the RCSB PDB – 2F2S)
This site is awesome, and I cant even begin to imagine how many smart people have worked tirelessly to make these data available to the average joe like myself.  Thanks to them.

The image of acetoacetyl-CoA thiolase of four different nearly identical chains identified by color in image to right.  I did not find articles (except one) stating that this was a membrane protein, and in which (outer or inner or cristae membranes) it would reside, and whether at the cristae pore or not.  My interest in posting pictures of this protein came after seeing that it has a 3dimensional symmetry that was visually quite wonderful.  Below are two sets of images taken at points of symmetry using the RCSB PDB link listed above. The symmetry is best seen with the ribbon molecules, but also is obvious with the space-filling and residue coloring modes.  I found this protein while looking for other mitochondrial membrane proteins, I am struck with how often nature mirrors flips and rotates basic protein elements to create function. In the images below molecules are colored as N-terminus (blue) to C-terminus (red); from 5′ end (blue) to 3′ end (red) — , bottom row is colored by residue. 3 green lines show symmetry (the line in z axis comes straight forward and looks like a point at the intersection of x and y. The green box shows a close vertical mirroring of the molecule…. rotated 90 degrees. I think the particularly interesting loops (four total) would have some special functions, seen at the top and bottom as presented in the ribbon diagrams.

Last image shows hydrophobic sites (right)… doesnt look like there is a region that would be membrane-bound does it?

It might sound silly to try to find out the size and shape of the known membrane proteins in mitochonria but just looking at the TEM images of mitochondria that I have accumulated over many years and many experimental conditions i am convinced that I can find some unique things to describe and show, but not knowing enough about the membrane proteins makes it less than satisfying. So at the beginning of the search, the ATP synthases was clearly fun, and easy to spot in some abnormal mitochondria.

Mitochondrial ribosomes: where was I

I googled “mitochondrial ribosomes electron microscopy” and expected the first citations up to be pretty recent…. nope, this one Kleinaw Neupert and Miller (not this miller) 1974 popped up.  Stating the obvious, muscles in the migratory locust certainly displayed many structures which were purported to be mitochondrial ribosomes.  Two particular images caught my attention: isolated cytoplasmic ribosomes and isolated mitochondrial ribosomes. In the “older” publications micron markers were required so this made it easy to determine the approximate insect cytoplasmic ribosome size vs that of the mitochondrial ribosomes (and at the same time look at the cristae for clues as to the ATP synthases-related bending and also to look at what might be something akin to mitochondrial pores at the base of cristae). Just as an aside here, the materials and methods sounded like a trip down memory lane for me, ha ha… though i used the Siemens Elmiskop model  1A introduced in about 1964, older than the 101.  Anyway some interesting measurements from an image here presented below.

About X=16nm is the distance between periods in the rhythm I see along side the mitochondrial RER tether.  This is based on the micron marker from the publication and also an estimate of ribosomal size from the micrograph itself  shown on the image.  Cytoplasmic ribosome about 21nm here, mitochondrial ribosome is about 15nm. Black bar micron markers 100nm and area enlarged is the box in the image at left. Left image has the mitochondrial portion outlined in red (as it is also in the insert with the cytoplasm there on the right side, mitochondrion on the left.

Isolated mitochondrion with smooth ER

A single isolated mitochondrion (blue)  and attached SER (pink) from a mouse at D28, likely isolated from liver,  postnatally having received NAC. This and other images were of controls for D28 mitochondrial pellets from hepatocyte specific GCLC ko mice also receiving NAC.  There is a lot of substructure going on at the attachment between the outer mitochondrial membrane and the SER membrane, and some tiny cristae right at that junctional tether. It is possible that a mitochondrial ribosome is in the field as well (dark dot rounded object in mitochodnrial matrix – middle right. (also there is a tiny piece of dirt, so dont be confused). So the periodicity between SER and mitochondrion seems to come out at about 35nm which is larger than I had hoped, but there is always the possibility that the structures were cut tangentially.

G protein, GPCR, GDP and GTP diagram from wikipedia

Wikipedia post (thank you wikipedia) with this diagram about G protein, G-protein coupled receptor GDP and GTP I thought was pretty good. “Activation cycle of G-proteins (purple) by a G-protein-coupled receptor (GPCR, light blue) receiving a ligand (red). Ligand binding to GPCRs induces a conformation change that facilitates the exchange of GDP for GTP on the a subunit of the heterotrimeric complex. Both GTP-bound Ga in the active form and the released Gßgamma dimer can then go on to stimulate a number of downstream effectors. When the GTP on Ga is hydrolyzed to GDP the original receptor is restored.”