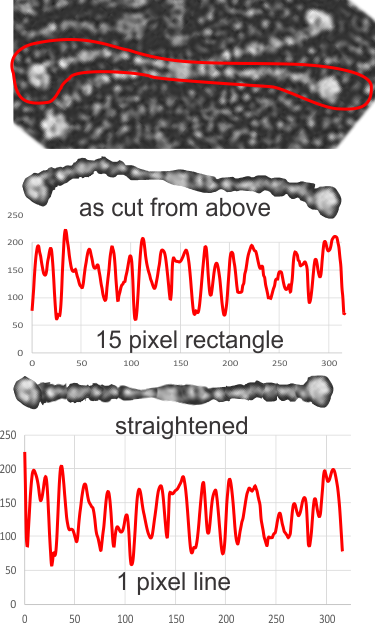
Using all the cuts and centering I can think of with CorelDRAW and Photoshop, there really doesn’t seem to be much difference in the LUT tables IF the molecule is more or less straight when cut apart from the image. If it is very crooked, then cutting and centering the cuts really does help.
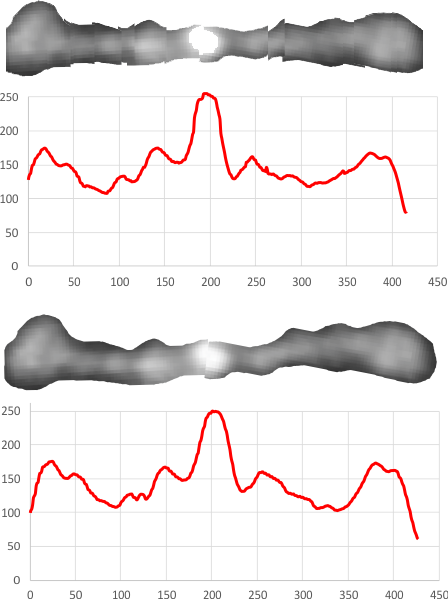
Using ImageJ to determine the LUT from a single line versus a 15 or 18 pixel high rectangle, again doesn’t seem to make a lot of difference. The example is a pretty lumpy shadow cast image of a dimer taken from a published image (bottom) and top is a line from an AFM image. The bottom line is that there are several regular “light” areas, and to estimate their distance from the center (N terminal of the dimer) is a current objective.

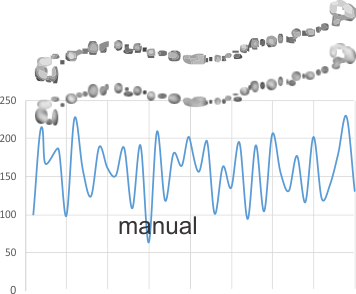
 Manual assessment of the same curved and cut out molecule is similar, but too time consuming to do on very many images.

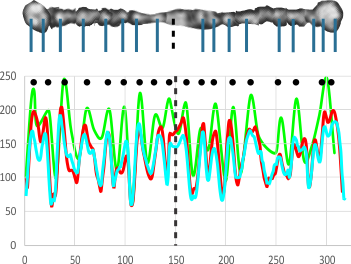
And a blend of the graphs from three samples with points and lines indicating agreement more or less suggests that the methods are pretty equivalent. That said, the easiest may be the best choice.

Maybe the difference in side peaks between AFM and shadowed molecules is important and telling. The AFM has about half the side peaks as the shadowed images. In addition, each shadowed image set has a different amount of coating, and that changes the light dark scale, and also the size of each of the areas that are “light” or “elevated”.