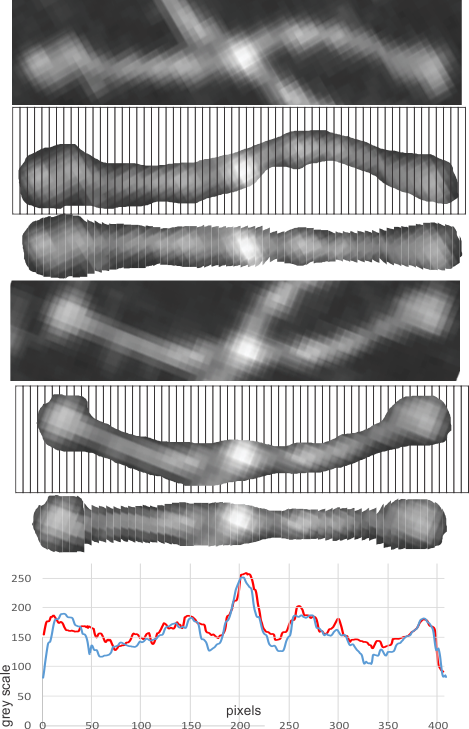
I have to assume that the changes in the look-up-tables (or the grey scale measures) mean something in SP-D shadowed TEMs and AFMs. It is interesting to see the different techniques and how they identify and highlight the different molecules. Here is a published (not by me) image of an SP-D dodecamer (which i have labeled d-82 just to keep it as a distinct entity) and applied the easiest technique that I have developed so far to plot out the differences in intensity along the arms. I have made the assumption that the arms are basically intertwined dimers that are held together at the Nterminals and some initial sequence of the collagen like segment (maybe up to C2 exon). The micrographs show a long distance where the dimers are close… longer than one would anticipate from the AA sequence number for the N terminal.
Two arms of this particular dodecamer were rotated in photoshop so that as straight as possible line encompassed both. There is some foreshortening of the arms where there is an arc to the arms. Previously measured this really didn’t amount to a huge difference in most images, but in some (not this one) it does… i will have to figure out how to deal with that later.
Different plots for each of the dimers was calculated in the following way. Image rotated, background erased, grid (equating to about 500 pixels) overlaid and used to “cut” the image. The image cuts are ungrouped and then centered horizontally. That image is exported as a tiff and opened in ImageJ, and a single line through the center (hopefully catching all the light spots) is drawn, and Analyze/Plot Profile applied, saved to excel and plotted. The plot is imported as a metafile in CorelDRAW and distance matched to the image.
In the image below, the red plot is the bottom dimer arms, the blue plot the top arms. Now learned, the whole process takes about 5 minutes… ha ha… but two weeks to figure it out.
