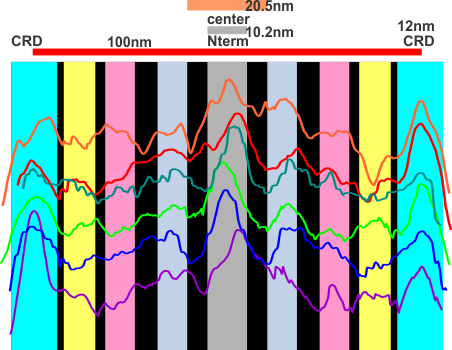
Sometimes it is nice just to have fun. Here are some LUT plots for dimers of SP-D, colored differently and also aligned at the brightest N terminal associations and the peak lightness of the CRD. I picked out some areas where there appeared to be consensus in terms of peaks in the plots. Certainly there are at least 5 peaks in each, and maybe 7 or 9. More images analyzed will tell for sure. In this image below the yellow band is probably needs to be narrower, maybe it is some element before the neck and CRD. Using these few plots it seems (as is noticed in the micrographs) that one can document a distinct N terminal dimension but an additional light area which includes part of the collagen like domain.
The center (Nterm+?) in many images measured with different techniques works out to about 25nm, give or take. so this measure is a little on the small side. The CRD is on the small side as well (but not by much). This is likely due to the fact that there is “space” between the peaks here which is left out, where on the original micrographs, the measures are inclusive of the grey areas between bright spots.