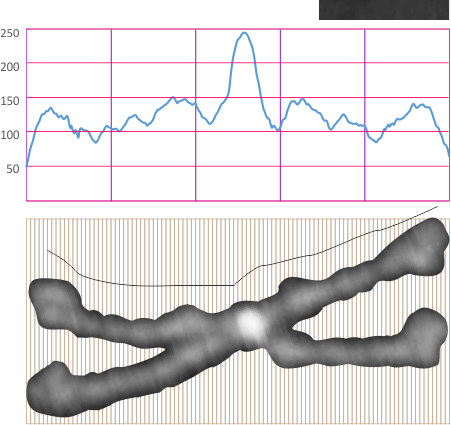
AFM is a “depth” measure for molecules. I found a reasonably good article which led me to believe that with sufficiently detailed look up tables for an (well maybe several) SP-D molecules that a 3D image of a dodecamer could be created. I took just one AFM microscopic image (I cant remember whose image it is, but give them credit for this image, it is certainly not mine) and it may not be the ideal image to analyze, but that makes it random and not given to my own particular analytical bias. This article is found here. afm_introduction
My thought now is to figure out a way to define a significant change (peak) in grey scale in terms of LUT tables generated using ImageJ. Image below would indicate that if the image is normalized to 100nm from end of CRD to the other (two arms of the dodecamer shown) and repeatedly sampled with different images (individual dodecamers) that using the brightest peak (the highest point in the molecule) normalized from background (which is right around 50) (wikipedia says:In photography, painting, and other visual arts, middle gray or middle grey is a tone that is perceptually about halfway between black and white on a lightness scale (119 119 119), however each AFM background is different though all could be adjusted to what the background is on the image here: about 40 40 40 so the beginning of the molecule is around 50 50 50. This gives just 200 steps of grey in which the peaks and valleys of the molecules rise and fall, with a clearly middle point common to all dodecamers.
It seems that if the scales are all normalized to 200 grey steps (assigning whether there is a significant difference in peak height, peak distance). Back to basic numbers. Image below has 100 cuts, and plots and height of AFM standardized. 