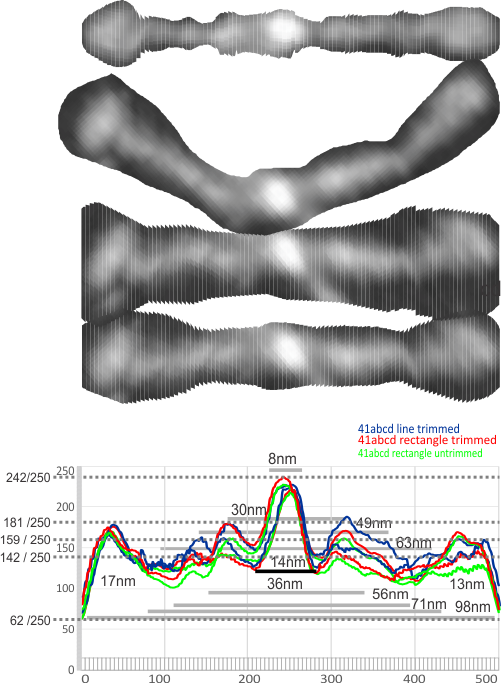
Six measurements of SP-D (molecule randomly named 41, someone elses AFM image) where the four arms were subjected to three different dissecting techniques.
1- causal trim of molecule before centering 1nm slices, centering exporting to tif, rectangular select and analysis of LUT values,
2 – more careful but not aggressive trimming of same SP-D molecule centering 1nm slices, centering exporting to tif, rectangular select and analysis of LUT values,
3 – latter molecules more carefully trimmed but a single line value for LUT. The 6 plots were superimposed (adjusted to 100 on the greyscale Y axis and 100nm on the X axis.
All images were exported to 500 data points (pixels) in the excel file but are equivalent to 100nm over the length of each of the two sides of the dodecamer arms. There is little difference between the tracings. Finding a summary plot from the columns in the excel file will provide numbers to determine what level of grey scale difference is significantly different from the base line which appears to be 55 or 60 on the grey scale.
1- central bright region 8nm and 94% brightness
2- first valley around central bright region 14nm and 121 grey scale brightness (47% brightness)
3- first peak on either side is 30nm (15nm on each side of center) and 71% grey scale brightness. and others can be seen…. three peaks between the center and the CRD.