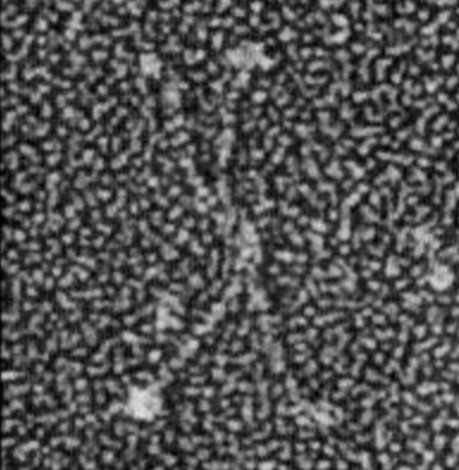
Measuring LUT table values (lluminance peaks) along the arms of SP-D dodecamer images taken with AFM is almost a no-brainer. Though peaks are not always evident by eye, they show up as a classical peaks in the LUT plots (A peak is defined as one point higher than two adjacent values, haha, I think i will use more than one point higher, but that is the definition). The AFM images are so good for showing height of a molecule that way that rotary shadowed images are certainly NOT. I have used mostly AFM images to try to convince myself that there are three peaks of graded luminance values along the collagen-like portion of the molecule. So this uses about 18 separate images found in the literature. 18 is not big number, I would love to have 100 more. But the rotary shadowed images dont even come close to showing that particular type of detail. But today I wondered how to make a “background” to be subtracted from each of the larger round bumps along the rotary shadowed…. I am thinking perhaps it can be done with “diameter”… that is establishing a mean diameter for the shadowed particles in the background and counting anything more than X% above that, a possible peak. The background diameter (derived fresh from each image) line could be drawn along the straight OR curved length of the SP-D arms as a line,(right down the center) and any deviation from that background diameter could be considered an “increase”, the amount of increase could be calculated by difference in the areas. This is a TEM from someone’s paper, i am too tired to find out whose… LOL, but it is possile to see differences in background lump size…. most evident obviously on the CRD, less evident at the N terminal (which is so different from the AFM images, but the diameter of the arm stretch could be measured.
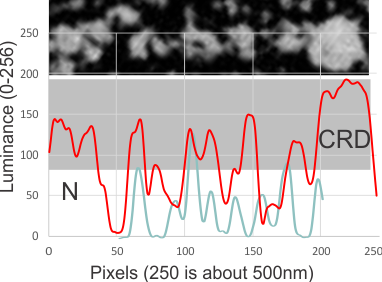
So I just happened on this particular example which I used (red line) and the background luminance height (blue line) and there are really four peaks above the background (nice, but waiting to be repeated in the dozen other arms I should measure. This is just ONE HALF of one arm. N terminal is marked on the left CRD is marked on the right (and clearly the largest area and highest luminance. This is different than the N terminal in the AFM, where the latter is the highest in luminance and also at least the same diameter as the CRD. It is time to look up the mechanics of shadowing molecules for TEM.

