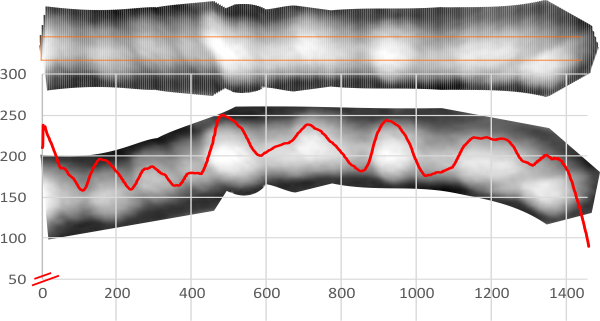
Looking for AFM images of CL-43 and SP-D and A and MLB and conglutinin i ran across this portion of a silk nanofiber and tested the centering and plotting of LUT tables using CorelDRAW and ImageJ. Looks like a nice plot.. took less than 5 minutes but supports the methodology. Red line is the LUT plot, over the original slightly curved fiber, top is cut into 300 slices and centered, then exported as a TIF and the luminence profile plotted in excel and superimposed.