Luminance plots of SP-D dodecamers (from other researchers AFM images) vary widely, due probably to preparation, chance arrangement of the arms when plating, bouncing of the cantilever of the AFM microscope, quality of the digital image and at least a few hundred other factors.
I am however convinced that usable information can be gained by looking at these images closely. In the process, there are a bunch of steps that need to be taken (in my opinion) to make the outcome easier to interpret. I don’t think this adds bias because it is done to all images, not just the ones i “like” or think look like I would want them to look.
1, this is likely a bilaterally symmetrical molecule, with unequal arm angles.
2, there is seemingly some arm arc angle as well.
3, the dimensions given in micrographs vary widely and therefore an exact dimension is not really known, even if the bar markers has been placed accurately, there still would have been wide variation in the size therefore 100nm is used to control that variable.
4, there is variation in the way different AFM record these same images (bouncing and skipping, focus, resolution
5, there is no consensus on how much of the N terminus is responsible for the bilateral symmetry
6, there is no consensus on the shape of the collagen-like domain
7, there is no consensus on what comprises the coiled coil neck region in the AFM images
8, individual arms in any dodecamer can be longer or shorter (curved etc) than the other arms which changes the LUT tables therefore each arm is adjusted to a 50nm length beginning at the N terminus
9, the position of the 2, 3 or 4 and even sometimes 5 peaks along the collagen-like domain are not centered, but a depth of a valley which is equal to 10 (out of 256) luminance units is used to call a blip a “peak” or not, in an effort not to bias results.
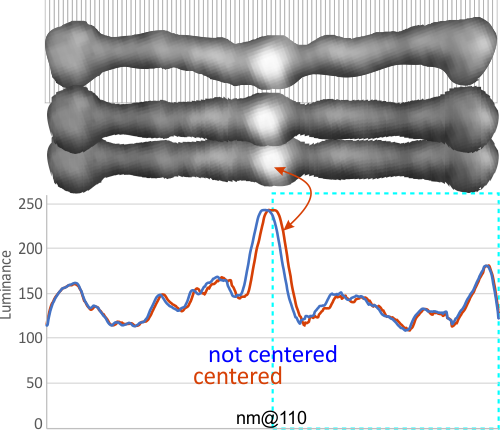
Below is a sample of two LUT plots (look up talbe = luminance plots) where two trimers – as a bilateral set from four dodecamer arms have been cut into one single-adjusted-100nm length. The image was cut at 1nm segments and centered horizontally (second AFM image from top). This image has the N terminus bright spot slightly off center, and the bottom AFM image it was centered (each of the two trimers now equivalent to 50nm in width. Plots show centered and non centered luminance values for the two images and it can be seen that they do not vary otherwise. In ImageJ the plots were derived from a rectangle of approximately 500nm x 15 which was drawn in the center (full length) of the images.
Some images are much more skewed, and so centering makes a bigger difference, this one is pretty close to center anyway but the technique is offered up here.