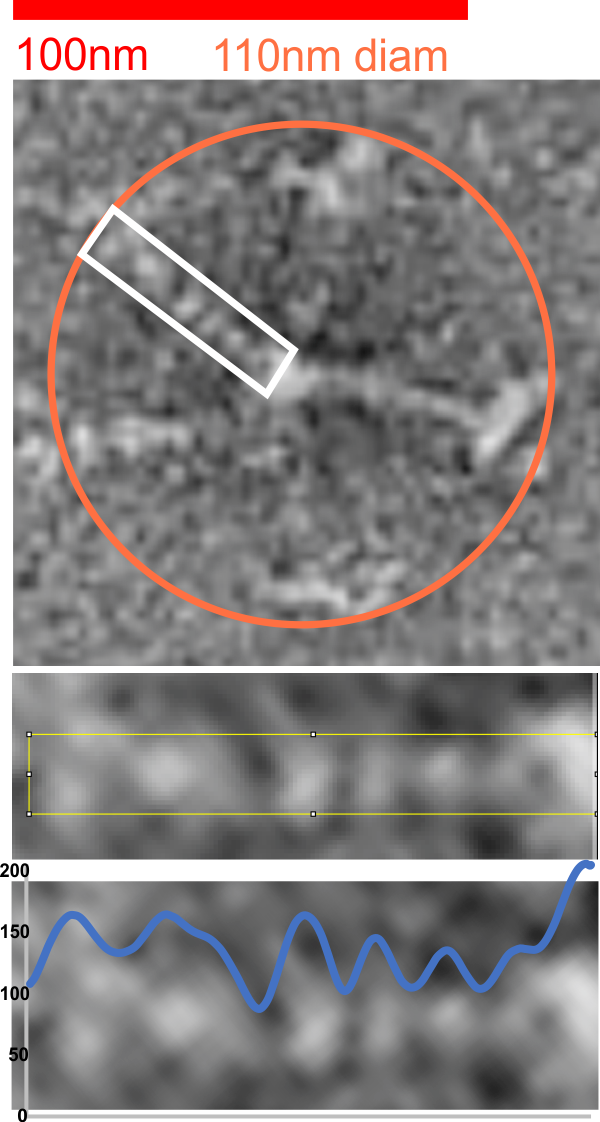
RhSP-D negatively stained and pictured in a publication by Perino et al I have used to map using LUT the peaks along the collagen like domain. There are now three techniques which provide info on the possible configuration of that portion of the molecule. The peak smoothness, low noise, and visual appearance make the LUT plots resulting at least as informative as AFM images.
red bar marker is that size provided in the original figure (Perino et al, Fig 4b, central multimer from the middle panel. The image was resampled in photoshop to 700ppi, but no changes in contrast were made. The image was rotated and the arm within the white box, cropped and exported to tiff and opened in ImageJ2 (FIJI). The image below this shows that area plotted (half of the 110 nm diameter found for the whole multimerm) going to the center of the Ntermini junction with the other arms (in this case on the right hand side of the image). Plot is in blue, the left side two peaks are the CRD (often showing a valley where the CRD are just beside or adjacent or overlapping each other), a little slow slope which would most likely be the neck, then moving to the right, 3 very obvious peaks, a lesser obvious peak and the Nterminus peak. The only problem here is that the 3 peaks in the collagen like domain usually are reversed in height, the highest peak being nearest the Nterminus…. so thats a little bit of a problem.