Same format for peak height as other peaks, and this peak is just lateral to the glycosylation peak in SP-D, when counting begins at the N term peak.
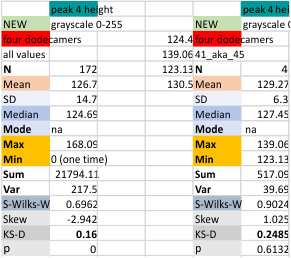
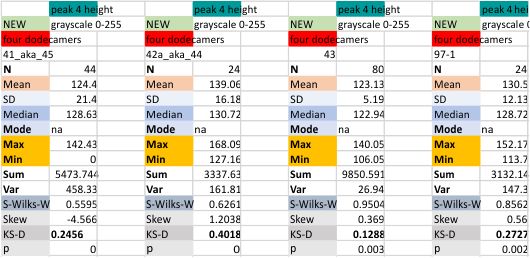
Same format for peak height as other peaks, and this peak is just lateral to the glycosylation peak in SP-D, when counting begins at the N term peak.
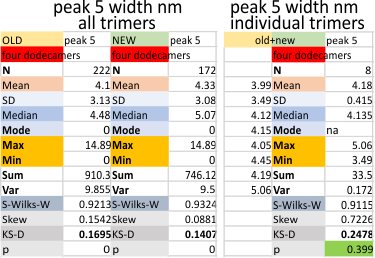
Peak 5 of the trimers of surfactant protein D is shown this post. The peak number is counted with the N termini junction peak as peak 1 and moving in a mirrored direction from that point toward the CRD peak. Peak 1 (N termini junction, well described, obvious and tallest); tiny peak (peak 2, not currently described, small, and between peak 1 and the alledged glycosylation peak); peak 3, the described glycosylation peak; peak 4 (lateral to the glycosylation peak, detected very frequently, large, and not as tall as the glycosylation peak); Peak 5, below, is not tall, and quite thin, but detected frequently enough to make it a likely event.
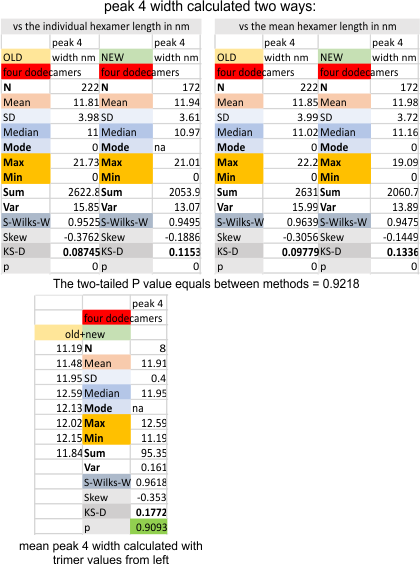
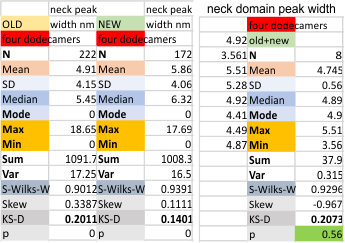
This peak, consistently appears, (98.8% of the time – 5/392) plots in a combined dataset, the old and the new (shown below). The fourth peak (N term peak=peak 1, tiny peak=peak 2, glycosylation peak=peak 3, and this peak lies lateral to the glycosylation peaks. It appears to have a lower peak height, and a little broader peak width. Data below, calculated two ways, the summation of the old and new dataset using four dodecamers, shows that calculating them in these two ways matters very very little (p=.9281). The peak width is about 11.9nm in width.
A peak in the hexamer plots where the “neck domain” of SP-D likely appears is registered about 78% of the time (135/172 plots) in the new 4 dodecamer dataset, and about 68% of the time (151/222 plots) in the old – four dodecamer dataset. This particular peak shows up as a slightly lower peak when the CRD domains dont quite cover this region. In molecular models (the neck and CRD domains are currently the only molecular models that I have found, show that the CRD are sort of “floppy” and sometimes appear to cover, or partially cover the neck domain. This arrangement is very apparent in the AFM images, and drawing the line which is to be used to plot the grayscale values of is highly dependent upon the imput of the observer. I plotted these lines trying to pick a center portion of the hexamers not varying the plot line to include or eliminate the influence of neck domain.
peak width for the neck domain is about 5 nm, but keep in mind this peak shows up under the CRD domain(s) about 70% of the time only.
The first rhythm and order I think i found as a graduate student in anatomy (light microscopy of cartilege) was the order of the beginning of long bone development in mice. Back then, (as in 50 years ago) many journals didn’t have cover images. At this time, dissolving all my records, publications, micrographs from the finite universe, I made this cover for one very lovely design in nature. I attach a very bad phone phot of the publication (not even I, its author, was willing to spend the highway robbery that some journal websites ask for an almost equally fuzzy scanned image of the original).
Here is my suggested cover, half century down the pike, and a free link to a terrible scanned pdf of the paper. 
Miller_Basom_McCuskey_Cartilage_1973
or HERE
This is an often hidden portion of the SP-D trimer, as it can be hidden under the CRD domain which can flop around and lie in different positions during processing. It seems that this peak will be something around 5 nm (top figure) depending upon how the CRD domains have obscured it. It might not have any subpeaks (the mode for this peak is 1 and it seems reasonable for this relatively tightly wound helical neck portion of the trimers (bottom figure).

It will be interesting what adding four more measurements to this dataset will confirm or refute. It is nice that the small N of four (composed of 50 to 100 separate grayscale plots of trimers (from a tracing of the hexamer) after image and signal processing, show some consensus. 
Only 18, times out of 636 plots of surfactant protein D trimers was there something that could be identified as a peak at the top center (or close to center) of the N termini junction peak (light green in the two top plots below). This was found in 3 ipeak.m signal processing settings, and one Lag-Threshold-Influence algorithms used in a batchprocess (also signal processing), and the rest of the time with counts of plots that had been image processed. One of the more prominent displays of that peak came from Gwyddion, gaussian blur and limitrange 100-255 filtering.
The bottom plot below (Gwyddion, gaussian blur and limitrange filters) was one of the two plots given to the citizen scientists from which to count peaks. None of those individuals chose to identify this thin N termini blip as an actuall PEAK. It clearly exists sometimes, but its relevance is not known.
The division of the N termini peak into TWO clearly identified peaks (rather than three which would include the central “green” peak below) was more common.

This program was organized by Aaron Miller from online references to using Lag Threshold and Influence to detect peaks in signals. The signal here is the excel output from a plot of a surfactant protein D dodecamer (plot of a single hexamer, CRD to CRD shown here) which was subjected to L-5, T-1, I-0.01. The peaks are identified (black line series) while the actual plot is shown as the blue line. Using this csv export I added the peak widths and heights using CorelDRAW. I will convert height into grayscale, and width into nm. Itdid take several minutes to create the bar graph which has been colored in accordance with known, as well as yet unidentified peaks which I have consistently observed over many plots of nearly a hundred dodecamers of surfactant protein D.
PURPOSE:
1) pie in the sky purpose = adding this peak finding option to ImageJ (which someone else will have to do (LOL)).
2) select just a few of the image processing programs, filters and masks that are free, optimal, easy, and produce images that can be analyzed, and likewise, find signal processing programs that are free, easy to use and identify which settings produce the most useful data for statistical analysis of images obtained from microscopy.
CRD=carbohydrate recognition domain (orange); Neck domain (yellow); unknown, wide peak (white); unknown low and narrow peak (pink); unknown large relatively tall peak adjacent to the glycosylation peak(s) (dark green); glycosylation peak(s) (light green); unknown tiny peak between N termini peak and glycosylation peaks (purple); N termini peak(s) (peach). Actually the halves of the hexamers should be identical however, the artifacts that arise from processing (true of all microscopy) show that not all elements are present in all tracings. Eg, the neck domain is sometimes covered up by the CRD domain as the former is largely nested under each of the three globby CRD in each trimer. How I trace the segmented, 1px line over the image is hugely important, and aim for the brightest places along the length of the hexamer. (Image used for this plot has been shown on this site so many times that posting it again just wastes space (LOL)).

COMMING SOON: Are there instances where people can more accurately identify peaks than image and signal processing algorithms?
This four month cycle of peaks and valleys for covid infections ought to get someone’s attention. (https://www.worldometers.info/coronavirus/) I sure have not heard anything about “four months”.
