I have found this website (i think i mentioned it before) but I really love it. Most textbooks (or i should rephrase this to be, textbooks of my era) don’t think about providing relative “size” and “distribution” to their descriptions biology, cells, organelles, etc. Somehow those relative size tidbits are what help me remember and understand what I read. So this kind of a chart for me is awesome. I laud the editors of this book… I WOULD LOVE TO HAVE a resource where they just had allllll the known protein structures that I could look at and superimpose where they belong over my electron micrographs. ha ha. Someday, someone will be able to do that.
Category Archives: Ultimate order, the cell
Desmosome dimensions
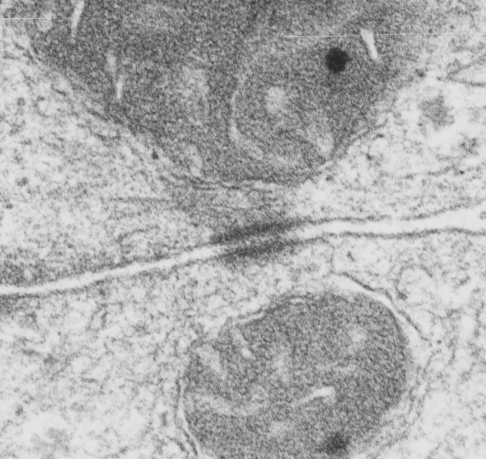
I found a cryo-EM paper of desmosomes that was pretty nice. Well desmosomes in the lower portion of the epidemis might be like desmosomes in liver, and it is very clear from this paper and others that the desmosome is adaptable, become different things in different cell types and tissue types. So this is a general description, but the basics are present in desmosomes of the liver. The measurements they show do NOT exactly fit what is stated for the “viable epidermis desmosome this publication states, but they are pretty close to those that I have re-measured just from their image, their bar marker, and my own repeated measurements from densities to densities.
The measurements I came up with are posted on the micrograph. The baseline measure came from the micron marker given for their own image. The measurements I made are for inner lamina to inner lamina of the two plasmalemmas; outer lamina to outer lamina for the two plasmalemmas (extracellular width); the pretty lucent area just extracellularly to each plasmalemma, the length and dimension between the desmoglein and desmocollin molecules (cant tell which is which) and also the “v” type structure, alternating and overlapping as the center dense line of the desmosome (in the extracellular space).
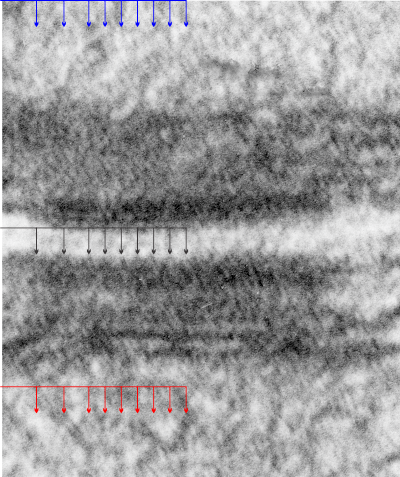
I thought it was interesting that one researcher called this intercellular linear pattern random, while another called the pattern linear…. in fact i think they both missed the pattern and I have outlined the cadherin rhythm in green. The distance between the repeat portions (ectodomains) of the latter looks maybe to be close to linear, or slightly curved, and the N terminals (to my way of thinking) create a picket fence, or zipper kind of pattern.
The micrograph I used for these measurements came from a paper by Ashraf Al-Amoudi, Jacques Dubochet, and Lars Norlen which is available online. Their bar marker is at the top (50nm) and all other measurements were made from this distance.
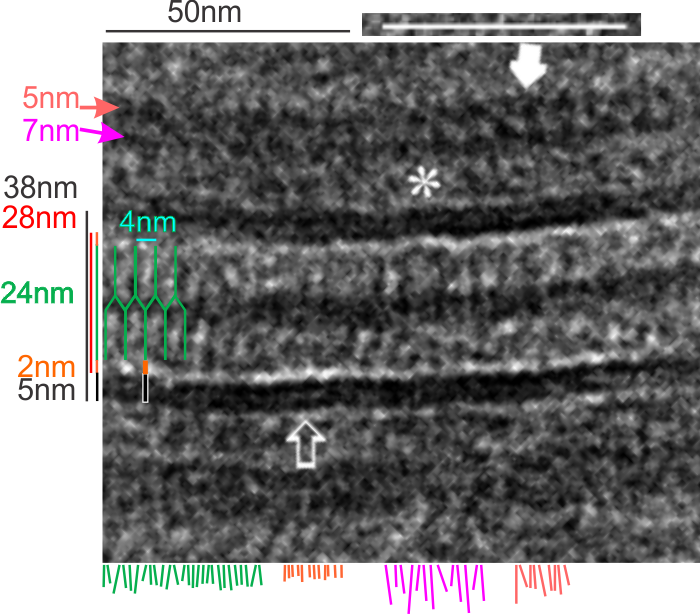
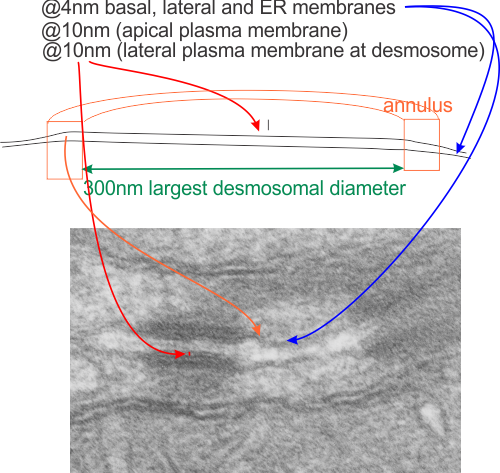
5nm approximate thickness of the cell membrane (one on each side of the desmosome shown here)
38nm from plasmallemma through to plasmalemma of second cell (THEIR MEASUREMENTS LIKELY TO THE CENTER OF THE TRILAMINAR MEMBRANE were about 33nm — pretty close)
28nm extracellular space (THEY DIDN”T MEASURE)
24nm is the @ height of the repeating units and N terminals of the desmoglein and desmocollin molecules (two molecules stacked=height (vertical dimension in this micrograph) (THEY DIDNT MEASURE). It is marked as the green stretchy-wire lines (likely a significant configuration for movement of cells that allows for some “give and take before break” which would not be surprising, but actually be awesome) and was easily drawn over many portions of many micrographs (this, and others of my own that i have posted before) .
4nm spacing between the repeating but alternating units of the desmocollins and desmogleins (THEY THOUGHT THAT THE VERTICAL LINES WERE 5nm APART, I think more like 4nm apart and staggered).
2nm orange lines, the lucent region just before the transmembrane segments of the desmocollins and desmogleins.
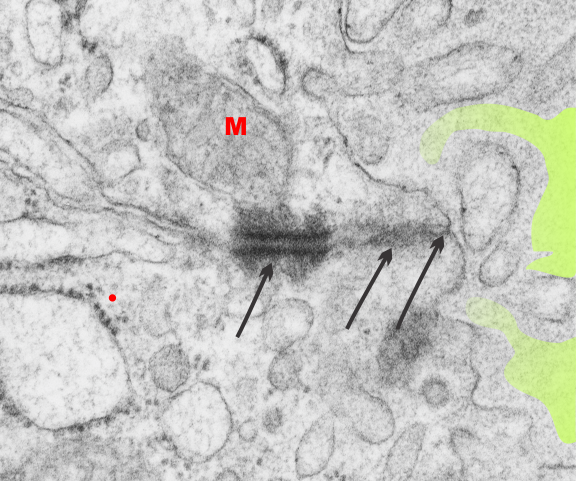
7nm pink arrow is a measured periodicity of one band of densities in the inner plaque, and the orange arrow represents measurements from adjacent periodicities. To me they didn’t look the same… the latter perhaps being further spaced and still alternating. White asterisk is from the original micrograph in the Al-Almondi paper, outer white arrow points to the same group of proteins as my orante arrow labeled with 5nm distances. Their white outline arrow points to a lucent area that i did not measure which is just intracellular to the inner leaflet of the plasmalemma.
My measurement lines are shown below the micrograph. Green: (i should have made black since they were measures of plasmalemmal thicknesses).
In liver, the intercellular space between hepatocytes is actually greater than the extracellular space of the desmosome filled with the cadherins…. which really is a very rigorously attached and spaced area.
One other difference in the way that Al Almoudi describes the “inner dense plaque” (most medial area of the intracellular desmosome structure) as having a single periodicity…. but when i counted distances between periodicities they actually were statistically different (p=0.03) with the most medial band of periodicities being further apart than those just adjacent and closer to the plasmalemma (but both in the inner dense plaque.
If i would going to hazard a guess on the shape of the molecules that make up the intercellular space of a desmosome i would have one which has a “blump” before the transmembrane domain, a blump at the N terminal (which is an obvious feature as the central periodic line in the desmosome). The transmembrane part would be quite thin since there appears to be a lucent line just on the outside of the plasmalemma of the two adjacent cells, and before the linear densities are obvious. The current protein databases make an extracellular domain 3-D molecule for desmocollin and desmoglein have a good chance of being fit to the densities found in electron micrographs.
Randomly arranged: not likely
Looking at a summary of desmosomes (so called macula adherens — spots of adhesion) one quote was “randomly arranged” which probably is naive. I find desmosomes (in the only tissue where I have looked seriously… hepatocytes, from several species) to something around a half to a micron, when found cut in the widest diameter. (that diameter There are many instances where the distance between the desmosome and the microvilli of the bile canalicululi is occupied by an adherens junction and a tight junction (pretty much common to epithelia). This is the point where i would have issue with the comment “randomly arranged”, in my experience (which is only limited by my age, occupation and brain) suggests that “very little in biology is random”. (check out this site for bio-numbers) that says the trilaminar membrane is between 4 and 10nm wide.
It is pretty clear that the intercellular space of the desmosome is constant “height” (approx 10nm) as opposed to the dimension across the diameter (approx 300nm at the widest point) which varies depending upon whether the cut is at an equator or tangential to the desmosomal spot.
It is pretty clear that the plasma membrane within the diameter of the desmosomal proteins is also rigid (owing to some kind of stabilization perhaps because of the transmembrane domains of the cadherin proteins that make up the intercellular portion of the desmosome.
It is also pretty clear that whatever is present in the outer mitochondrial membrane (some kind of link and presence of some type of intermediate filaments) that tether the mitochondrion to the plaque proteins of the desmosome also creates a rigid appearance to that membrane.
Desmosomal mitochondrial tethers: fetal follicular cells of the thyroid
Just in case anyone is interested in whether there are desmosomes which are tethered to mitochondria via intermediate filaments in cells other than those I have reported so far then look at a fetal follicular cell (of the thyroid) and it is very apparent that these pretty large desmosomes with mitochondrial attachment via filaments is certainly happening. This site is by the tight junction, adherens junction, and the desmosome. Just like hepatocyte D-M tethers, which tend to occur around bile canaliculi in hepatocytes.
Red M, mitochondrion; three arrows point to three different types of intercellular junctional complexes (including the desmosome and the mitochondrion (most left of the three); colloid in the lumen (light green shading) can be seen on the right hand side of the electron micrograph. Red dot is @ 27nm in diameter representing the size of a ribosome.
Does every protein precipitate down to a 10 nm glob with TEM?
When examining protein structure with TEM it doesn’t escape me how the patterns sometimes fit into these very regular but seemingly not relevant patterns. In looking at the densities which appear in the center portion of the desmosome and also the diameter of cross sectional cuts of the intermediate filaments associated with desmosomes, i get confused as to why both look to be about 10nm.
I have tried to google such phrases as “texture of lead citrate staining” with TEM, or uranyl acetate or osmium textoxide, or some other texture analysis that might put a “cap” on the limits of where one can go when measuring protein patterns with TEM.
Any images that I review for protein patterns I am forced to find adjacent areas and see if similar patterns occur.
It makes sense that fixation conditions will greatly influence the final texture of the tissue, and I doubt whether there have been any well controlled morphometric studies comparing the myriad methods for processing tissues for TEM. I found an article bu R. W. Horn on this and here is the first two lines as as quote “For the practical biologist applying electron microscopy to the study of biological macromolecules, there are serious problems in obtaining high resolution images showing detail below 2.5–3.0nm. The limitation in resolution from biological specimens can be attributed to support film thickness and granularity, specimen preparation, irradiation damage, focusing effects and possible contamination in the electron beam.” which i will not read. (Somehow it seems a travesty that Wiley (Bruker) think that I should pay to read a pdf the data for which were mostly like funded with public funds — i wont pay). But some terminology and also the recognition of 3nm being an important “stop” point beyond which any assessment of rhythm or pattern in a micrograph would just be “gestimate” is reasonable. I actually, at least for my micrographs, probably from negatives not developed with the most fine grain developer (a penny wise and pound foolish choice made in my career to not use the most fine grain developers for my negatives and prints…I was at that time unable to think to the future of microscopy and structural protein biology and the links possible between the two fields, so sad really).
So here is a micrograph of a mouse hepatocyte desmosome which is cut tangentially, the central dense line where the desmocollin and desmoglein come together (but it is still slightly visible), but there areas where the latter two molecules traverse the plasmalemma, there is a little density… at least I think it is periodic. I have added black arrows to indicate where i see those periodicities in the outer lamina of the trilaminar membrane, and moved that same set of arrows to different sites in the micrograph (in this case both are intra-mitochodrial) to see if by chance the same periodicity might arise (thus helping to convince myself that the periodicity actually means something). You can see that the red and blue arrows dont line up exactly with any matrix proteins in the mitochondria.
More desmosomal mitochondrial tether samples
Mostly, if not all, hepatocytes from a variety of species. Some of these images have the species designation in a lower case letter as follows: r=rhesus, st=stub-tail, m=mouse, oops, i might have put r for rat somewhere, f=ferret, gp=guinea pig. May not all be present but must a few are marked. I am looking for species differences but these are not ideal images for such detail and are just archived samples collected in 40 years of microscopy.
There are certainly differences in size, and also number of mitochondrial tethers that can be seen, and the biggest nicest desmosomes I have seen are in tongue (image below is bovine i believe — thank you to whomever’s image that is), and the most numerous of course in skin. I havn’t bothered to add micron markers…. it seems to be quite variable depending upon where in the “disc, or spot” the section occurs. The mitochondria and cristi give relevance to magnification anyway.
Desmosomal-mitochondrial tether Stub tail monkey hepatocyte
This particular electron micrograph of a desmosome with mitochondria tethered to either side shows some nice orientation and detail. Particularly the intercellular space has the zipper lines that are the desmocollins and desmogleins. These lines have some regularity, but owing to the enormous numbers of possible orientation that one could get in TEM, it is not that likely that a perfect one will ever arise. I even consider the roundness of the “spot” desmosme and the possibility that the organization is radial, wouldn’t that be fun. Someone out there with 3D imaging skills could certainly test this with the molecular models that do exist. I think it would be just as fun as looking at the tomographs of thicker sections. Brown dots are likely areas where desmocollins and desmogleins are intersecting-interacting, and these represent the intercellular central dense line of the desmosome. Black lines are areas where the 5-repeats in desmocollin and desmoglein (i suspect) are spanning the intercellular space. The black dots are some kind of periodicity visible on the outer lamina of the trilaminar plasmalemma. I didn’t find any good cross sections of intermediate filaments up near the mitochondria…. though I though they were there as dense elongated areas, not nice round cross sections. (BTW… love the two eyes — aka intramitochondrial granules… these actually are very likely arranged strategically within the mitochondria near places of tethering… would love to know where and why). Red circles are around little interesting radial symmetries… that showed up…
Anyway, this micrograph and inset are from a Stub tail monkey, which was, for all intent and purposes, a control, thought it did receive a tiny test dose of artificial blood.
Human hepatocyte desmosome
I have no clue, nor any record of how and why I ended up with a couple of blocks of human liver (most notably taken while i worked at childrens hospital) no way to trace the origina at all. It is kind of interesting, this sample had lots of glycogen, also very dense mitochondria (might have preserved in a different laboratory — actually definitely by someone else since I never did any tissue exams on human tissue). The desmosome (which is not quite a double-mitochondrial tether (only one clearly tethered but the mitochondria in the adjacent cell is obviously tethered just down (or up) in the same block. This desmosomal mitochodnria tether is, like many, just adjacent to the bile canaliculus.
Periodicity in mouse hepatocyte desmosome
I measured the periodicity that I saw (looking like a little zipper) on the outer plasmalemmal membranes of two adjacent hepatocytes at a desmosome (green dots). They seemed to be spaced about 19nm apart, and were small (maybe 7 or 8 nm densities). In addition the intercellular space in this desmosme really had a nice alternating linear look where the desmocollins and desmogleins would lie. Micrograph on the left, unretouched mouse hepatocytes and desmosome (mitochondrial tethered on the upper left, but somewhat inconspicuous), green dots, zipper densities, red spots, ribosomes, lines, likely to be intermediate filaments.
Rhesus monkey hepatocyte desmosome
This particular micrograph is too tangential to the desmosome to show a lot of detail but it does show some cross sections of what I presume to be (because the size is about 10-11nm) intermediate filaments. These crossectional “dots” of IF are in the right position above the inner desmosomal plaque. Red dots = approximate ribosomal size (27nm) , blue dots = approximate IT cross section (about 11nm). Micron marker is 100nm for both images. Image on the left is unretouched, image on the right has dots over ribosomes and intermediate filaments for comparison with image on the left. Rhesus monkey, control biopsy, before the administration of perfluorochemical blood substitute, #71 female, fixative=modified Karnovsky’s (isoosmolar Chick-fix), Millonigs uffer, 2% osmium tetroxide, EPON 812.