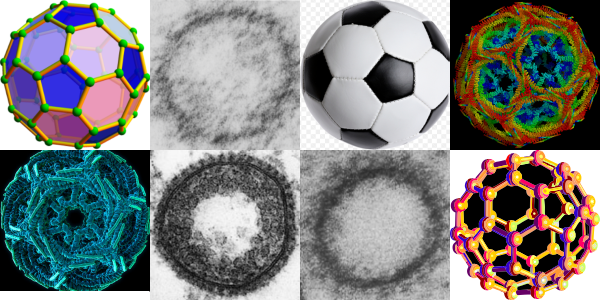
This is a wild goose chase looking for structures which explain and identify those which I have seen repeatedly in hepatocytes (and other cells), this time including clathrin coated vesicles and COPI and COPII vesicles. I am continually amazed how certain motifs repeat themselves in the microscopic, molecular and modern world. Stability in structure seems to transcend size. So image below is a collection of fullerene diagrams, some from my own electron micrographs, one from a widely republished electron micrograph (credits to the author if i knew who it was) and some from various wikipedia posts and of course the most widely recognized fullerene structure… the soccer ball. Just for fun but also tying in the concept that nature made it first. There is a difference in magnification from the upper left (i think around 1 nm – which actually sounds too big to me) — to the soccer ball 22 cm in diameter — well you can do the math 2,200,000,000 nm.
Category Archives: Electron micrographs of liver
Awesome video from transmission electron micrographs
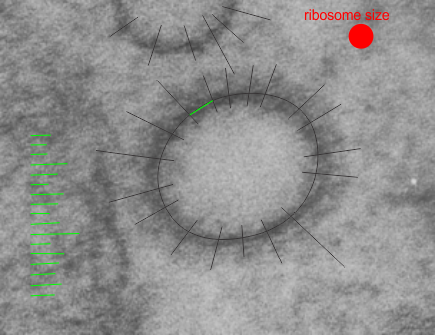
Here is an awesome video… loved it. I was searching to find the approximate dimensions of clathrin… to see if a vesicle in one of my own micrographs possibly had clathrin protein… the distance between little spokes radiation into the center of the vesicle was approximately 60nm +/- 5nm and I found this really remarkable movie. And i also commend that it is freely shown, and very colorful.
At the same time I continue to find TEMs from some dude in Germany whose research was very likely funded with public funds there but who also seems so insecure that he needs to “tag” that property (belonging to everyone in the world and very likely paid for by government funds) as his own… what a small mind he has– totally small and self indulgent.
So here is the little structure I measured the proteins in…. maybe clathrin, maybe not. Measurements based on ribosome size in THIS micrograph assuming mammalian ribosome is about 27nm in diameter. Distances between radial arms is about 60nm. Micrograph is from a 50 day wc/ii mouse. Black rays indicate location of inward projecting densities and distances between those lines at the perimeter of the vesicle were measured. A portion of a mitochondrion is on the left. Ribosome size is shown as red dot.
Certifiable? or does rRNA on RER rock
I was looking at liver electron micrographs, looking for mitochondria, trying to see whether cristae juntions are such a noticeable feature as is claimed, boy I can not find them easily. But in “boredom” not really boredom, more frustration, I decided to punch in a “kick” beat to the spacing of ribosomes along the RER membrane. I hope this fun time with Fruity Loops doesn’t distract me from doing real science…. as I can see how fun it would be to use a top hat, steel drums, cymbals, for some ribosomes a little further away, and a base beat for those that are very clear and a blip for those that are faded out and then play two tracks together (opposite sides of the ER membrane being a separate track each). Now you know why I chose the title for this post “certifiable” (i am not crazy, as sheldon cooper says, my mother had me tested),
Ultrastructure of some mitochondria and RER associations
It is really likely that some of the patterns in electron micrographs (even though they were taken decades ago) can still reveal some of the unique ultrastructural architecture that cells possess, even new and useful data. (This is an apologetic of sorts, since I don’t have the latest in tomographic equipment or a wet lab but still find amazing structures in the old TEMs i have lying around.) So these images are offshoots of a previous post on mitochondrial substructure, and I noticed two new things in this same micrograph. That is:
1) that one of the mRNA and ribosomal spirals has a dense center and from it radiate spokes (red arrow in left and top middle images) and…
2) there is a portion of mitochondrial matrix? intra cristae? area which is clearly organized into repeating parallel layers with central dots. (this is best seen in the images to the far right. The boundary between mitochondrion and RER is black dotted line, lower images on right; black box on left is area enlarged (top and bottom middle) one with contrast enhanced (bottom) and one set of mRNA+ribosomes spiral, and black line marking line likely mRNA, and to the left at the red dots a vertically oriented multilayered organization of mitochondrial (membrane?) cristae… the black box surrounding this particular area of interest denotes the two images to the most right. There is no question about the organization of vertical-parallel lines, and dots. These are the blue dots in the two lower right hand figures. Vertical lines with vertical organization of the rounded densities is quite striking (upper right). This is mouse liver, neg 6118, block 5220 and from my notes it received tween and PP5 at 50mg/kg and this is a 72 hours necropsy. Right top is same as right bottom, where the central dense dots and outer dense line – substructure is observed.
Mitochondrial interactions with RER
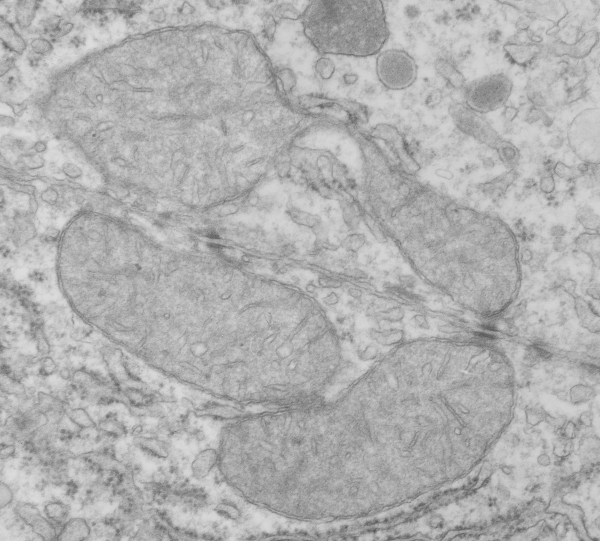
Hepatocyte here, GCLC ko mouse, shows the donut and irregular configuration that is common in circumstances where mitochondria are stressed (I personally have seen it several times but in unrelated experimental circumstances so it is probably a generic response mostly). In this really opportune section one can see a mitochondrion (with an odd donut shape) ont eh left, and a section of RER which has been sectioned tangentially showing the closeness and absolute regularity of the ribosomes along a spiral of mRNA.
I bet at some point all information about these association and the proteins (i saw a list that mentioned in the 800s and counting) in the inner and outer and cristae membranes, and the cristae junctions as well as the matrix will be modeled. Until then, circumstantial evidence for the power of the interactions between mitochondria and other organelles (and cytoskeletal proteins) has to suffice.
The ribosome spirals here look to have approximately 7.3+/- .47 (SEM) ribosomes per spiral, n=9 (a small sample but the best orientation, and a single micrograph…. so this is just a suggested number obviously. 19735_73218_#201 liver alb+/- Gckc -/- postnatal day 28. liver mouse, no NAC.
One thing abou these mice that is pneumonic is the dilated ER, a mix of smooth and rough, ribosomes spaced and the presence of the little bubble-blip invaginations of ER within the outer RER membranes. These mitochondria also display fission lines and tubular cristae, and quite a bit of it. Blue dotted line (outline of one part of a mitochondrion – that one tangentially sectioned beside the RER, white box, area for enlargement to the right. Upper image on right has cytoplasmic ribosomes in mRNA-spirals (orange) and lower image is contrast enhanced to highlight the spirals of cytoplasmic ribosomes. I really don’t think there are any good examples of mitoribosomes in either of the two mitochondria shown here.
 Numerous proteins in the outer mitochondrial membrane (encoded by nuclear DNA) target and or are attached to cytoplasmic ribosomes. Cytoplasmic ribosomes have been visualized on mitochondria membranes (that would be the cytoplasmic face of the OMM). These are suggested to be linked by the translocase of the (outer) mitochondrial membrane (TOM) and it is reported that the ribosomes are in clusters (Till Klecker et al, 2014 Trends in Cell Biology) and that pretty much looks like these nRNA-ribosomal spirals… tidily wound.
MDVs, mitochondrially derived vesicles (about 70-150nm) are purposeful buds of membrane derived from mitochondria which are targeted to lysosomes, and maybe other organelles.
Just an “aside” here, but is it possible that the donut shaped mitochondria (invaginations, and extra turns and indents) might be somehow a deliberate attempt to increase surface area for interaction with other membranes. Another question is the orientation of cristae. I have looked for cristae pores, and that relationship… just not seeing it overtly.
More on Form follows function in mitochondrial cristae organization
Not much text with this post, but here is a highly simplified, not real detailed, summary of what some think about mitochondrial cristae morphology. This is very basic, i intend to make some really nice diagrams including the inner mitochondrial membrane proteins as represented in 3D by the protein databases. That will include the OSPHOS proteins, and the channel and transport proteins and the cristae junction proteins. But for now…. and blatantly missing several types of cristae (triangular in particular) here is a line diagram of cristae and some associated properties. The electron micrographs on the “aerobic” side of the diagram are from various images of hepatocyte mitochondria just cut out of existing micrographs, on the anaerobic side, the mitochondria are selected from isolated mitochondrial fractions. Both are traditionally prepared TEM processes. Abbrev: IMS, inter-membrane space; white rim area. Outer and inner mitochondrial membranes=black lines. Grey interior= mitochondrial matrix. Micrographs, not all the same scale,

While i love the tomographic 3D reconstructions of portions of the cristae, it seems that this is sort ofwhat most of us rendered in our minds before those data confirmed the structures.
Crista junctions in mitochondria
I am trying to visualize crista junctions in mitochondria in the liver (mammalian). These might be visible here, in a KO mouse which has increased oxidative stress (previous posts). It looks to me like there is a small consistent area at the place around cristae approaching the outer mitochondrial membrane that looks “different”? Find the 100nm markers (vertical at the edge of a crista and horizontal by the red dot over on the right hand side) are an approximate marker for the size of a cytoplasmic ribosome (27nm) and calculation for 100nm from that.
Cristae in this particular mitochondrion and many others show an increase in the amount of matrix space and a more vesicular type of cristae, and some times have cristae inclusions.
Mitochondrial and ER inclusions, and nuclear invaginations in Gclc hepatocyte specific KO mice
Hmm. Is there a possibility that the inclusions in the inter-cristae space of mitochondria, the inclusions sometimes seen in nuclei (probably invaginations), and the iron-like dense inclusions in the ER hepatocyte cytoplasm, are linked by enzymes that are involved in the maturation of cellular Fe/S proteins for which mitochondria are important. These images are from Gclc hepatocyte specific KO mice, one image (with the nuclear invagination with iron-like spicules upper left) came from a KO that was rescued with NAC the other two micrographs are from wc/ii mice, unrescued, at day 50.
Desmosome dimensions relative to adjacent membranes and mitochondria
It seems to me that there is a pattern of thickness changes(width or height if you wish… because of the orientation of the diagrams below) and the rigidity of the plasmalemma inherent in the desmosome (likely due to the transmembrane parts of desmoglein and desmocollin ) and that rigidity includes a specific intercellular space dimension. I have seen this published at about 34-38 nm (that is, from the inner leaflet of the plasmalemma of one cell to the inner leaflet of the plasmalemma of the adjacent cell) to be something on the order of 38 nm. Using that dimension, if i measure from inside plasmalemma of one cell to the adjacent cell and compare that to the width from the same places in the 200 nm ring or annulus around the desmosome there is going to be a change in the dimensions (which i could measure as just a few nm greater than that within the area of the desmosome proper. And, then a reduction in the intercellular width (per the more routine proximities of two cells) which becomes something like 40 nm.
Here is an article which suggests some dimensions for the desmosome, but does not address adjacent variations in the plasmalemmae including the anulus. You can compare with two images and measurements below. Keep in mind that the two images below are not derived completely randomly, as I picked two which had substructure which was clear enough to measure. The annulus of these two desmosomes is indistinct, and longer than that seen in other desmosomes. This likely relates to the plane of section on a perpendicular axis of a round desmosome and surrounding annulus (the latter being increasingly seen as one sections nearer the periphery of the actual desmosome).
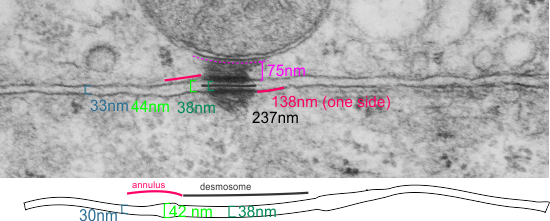
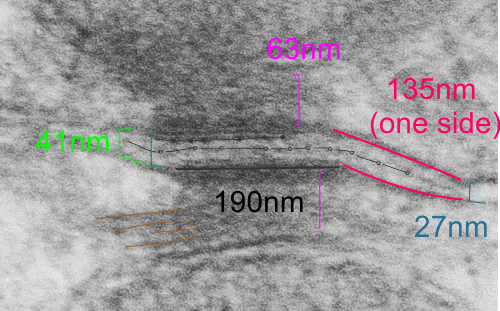 top diagram shows a length of two adjacent plasmalemma, measurements relative to that image, bottom one is a different desmosome, notice brown lines for intermediate filaments, black line for length of the desmosomal spot, dotted lines at periodicities of the bridges between desmocollins and desmogleins, outer dense line with dots, periodicities of the extracellular membrane anchor, pink bracket, thickness of the desmosomal intracellular elements, which includes proteins of the intracellular anchor (desmocollins and desmogleins) plakoglobin, plakophilin, desmoplakin and intermediate filaments (visible at the desmosomal-mitochondrial tether on the bottom more clearly than the desmosomal-mitochondrial tether seen at the top of the lower micrograph. While a big deal is made of the inner and outer dense plaques of the intracellular part of the desmosome, the lower portion of the lower micrograph doesn’t make that case. Were the micrograph sectioned end on to the intermediate filaments below, there might be a more visible inner dense plaque. The outer dense plaque (plakophilins, plakoglobin portion and desmoplakin proteins) is well defined. NB, there is a “flatness” or “rigidity to the outer mitochondrial membrane where the intermediate filaments lie beside it… i hope to search for proteins that might be involved in the linking of mitochondria and intermediate filaments.
Desmosomal-mitochondrial tethers (4) near bile canaliculus
THis Electron micrograph has at least two mitochondria that are attached by intermediate filaments to desomosomal junctions. Adjacent hepatocytes from a rat, which was exposed to carbon monoxide while pregnant with pups. I have to presume this biopsy was taken at the time pups were delivered, around GD 21. Incidentally there are some funny mitochondrial shapes here, and lots of vesicles, and peroxisosomes. I do not remember if any morphometry was performed on these liver samples.
