Category Archives: Ultimate order, the cell

The beauty and order of life is astounding.

Negative stained SP-D dodecamers and multimers: size

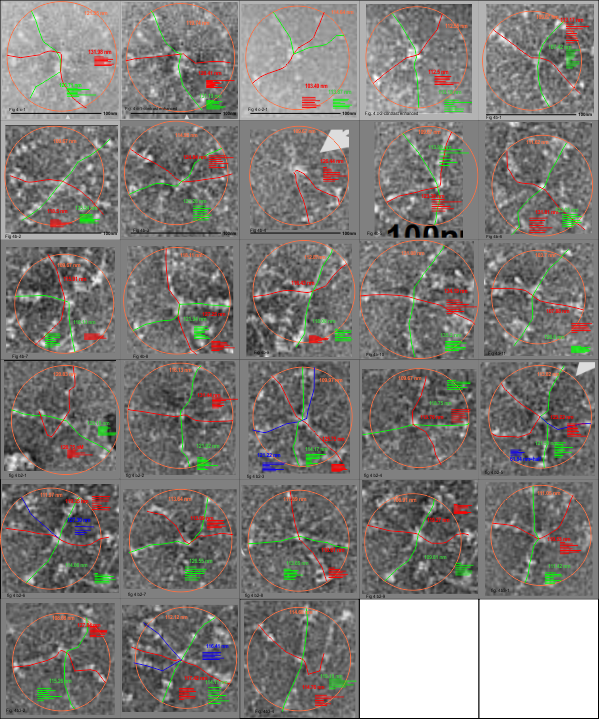
I have measured the size of the SP-D images in the article by Perino et al, and their assessment of whether SP-D assists in controlling infection with vaccinia virus. The purpose was to assess whether there was a difference in the size of the molecules from one figure to the next, (which there ws not : Fig 4c-molecules 1-2 =118.71 nm +/ 7.8 nm; Figure 4b 1-11 =118.73 nm +/ 8.76 nm; Figure 4b2 molecules 1-9; =117.27 nm +/ 5.94 nm; Figure 4b3 molecules 1-4; 115.52 nm +/ 4.74 nm. They provided bar markers for each of the images and this was used to determine the arm lengths and total diameter. (SEE MY figure below).
This is the first negative stained group of SP-D dodecamers and lower number multimers that I have measured using the line-node method and the diameter method. While the text appears to suggest that this is recombinant human SP-D (just like Arroyo et al says their dodecamers are recombinant human SP-D) the difference in size between the AFM (latter paper) and negative staining (Perrino et al is huge) i.e. 30 nm approximately.

Figure below shows exactly what molecules looked like, and exactly where i anticipated the molecules to begin and end.
Negative stained SP-D

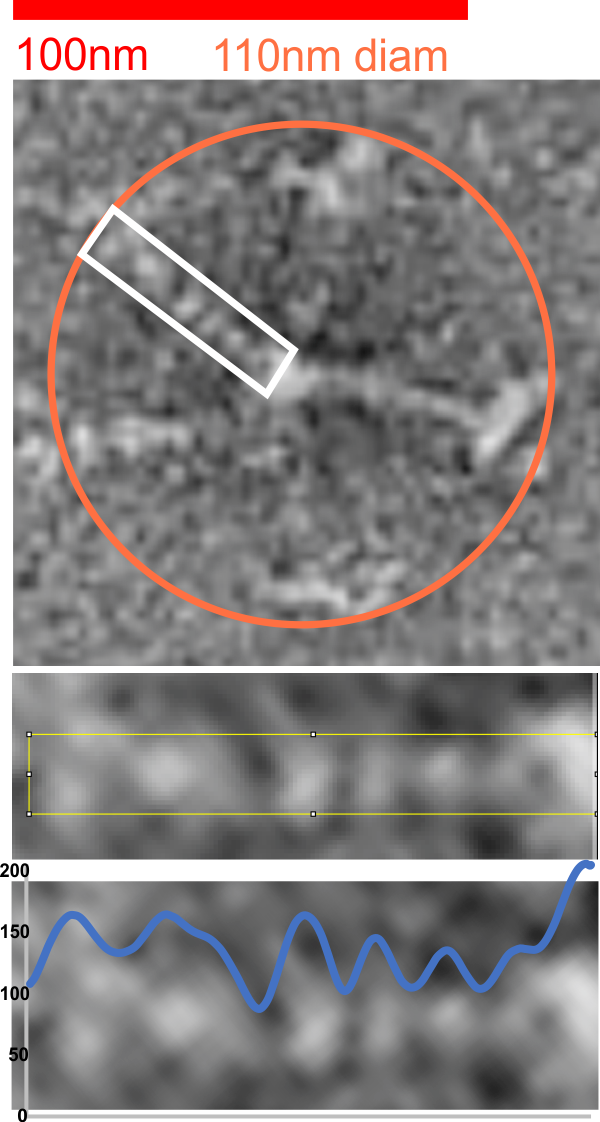
RhSP-D negatively stained and pictured in a publication by Perino et al I have used to map using LUT the peaks along the collagen like domain.  There are now three techniques which provide info on the possible configuration of that portion of the molecule.  The peak smoothness, low noise, and visual appearance make the LUT plots resulting at least as informative as AFM images.

red bar marker is that size provided in the original figure (Perino et al, Fig 4b, central multimer from the middle panel. The image was resampled in photoshop to 700ppi, but no changes in contrast were made.  The image was rotated and the arm within the white box, cropped and exported to tiff and opened in ImageJ2 (FIJI). The image below this shows that area plotted (half of the 110 nm diameter found for the whole multimerm) going to the center of the Ntermini junction with the other arms (in this case on the right hand side of the image). Plot is in blue, the left side two peaks are the CRD (often showing a valley where the CRD are just beside or adjacent or overlapping each other), a little slow slope which would most likely be the neck, then moving to the right, 3 very obvious peaks, a lesser obvious peak and the Nterminus peak.  The only problem here is that the 3 peaks in the collagen like domain usually are reversed in height, the highest peak being nearest the Nterminus…. so thats a little bit of a problem.

Measurements on rat SP-D size, two treatments

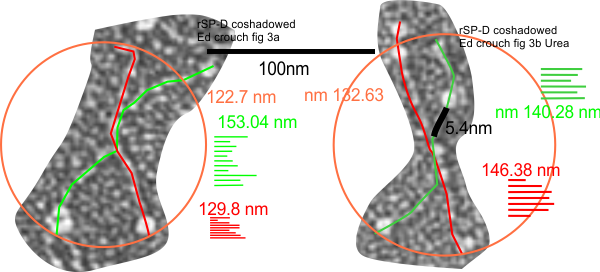
Measurements on rSP-D size, two treatments in a publication by Ed Crouch et al, JBC, 1994 where they state “Electron microscopy of freeze-dried preparations demonstrated a highly homogeneous population of molecules with four identical rod like arms (46 nm in length), each with an 8-9-nm diameter globular terminal expansion”. (to add coiled coil neck – italics mine)

Their measurement of arm length seems just a little short to me since there is no bar marker in their micrographs, using their bar marker to check is not possible.  I used the width of the collagen molecule- coshadowed – to determine the magnification and two methods of measuring the arm length (diameter touching three CRD domains, and vector-node lines (obviating the need for finding the curvature of the arms)) which puts the size of their rSP-D molecules at about 135.5nm + 7nm (n=41, that i found, using excerpts from their Figures 3a and 3b).  Their assessment of 46+9=45 x2 is considerably less than 100nm thus creating a discrepancy that cannot be accounted for by adding the nm of the N termini peak to their estimates.  Overall, using the collagen shadowing width does put their image right in line with other SP-D (human and rat) molecules in terms of overall size. No difference in measurements appeared to be present between molecules treated with urea and those not.

Image below samples how I measured the rSP-D

Discrepancy in size – SP-D

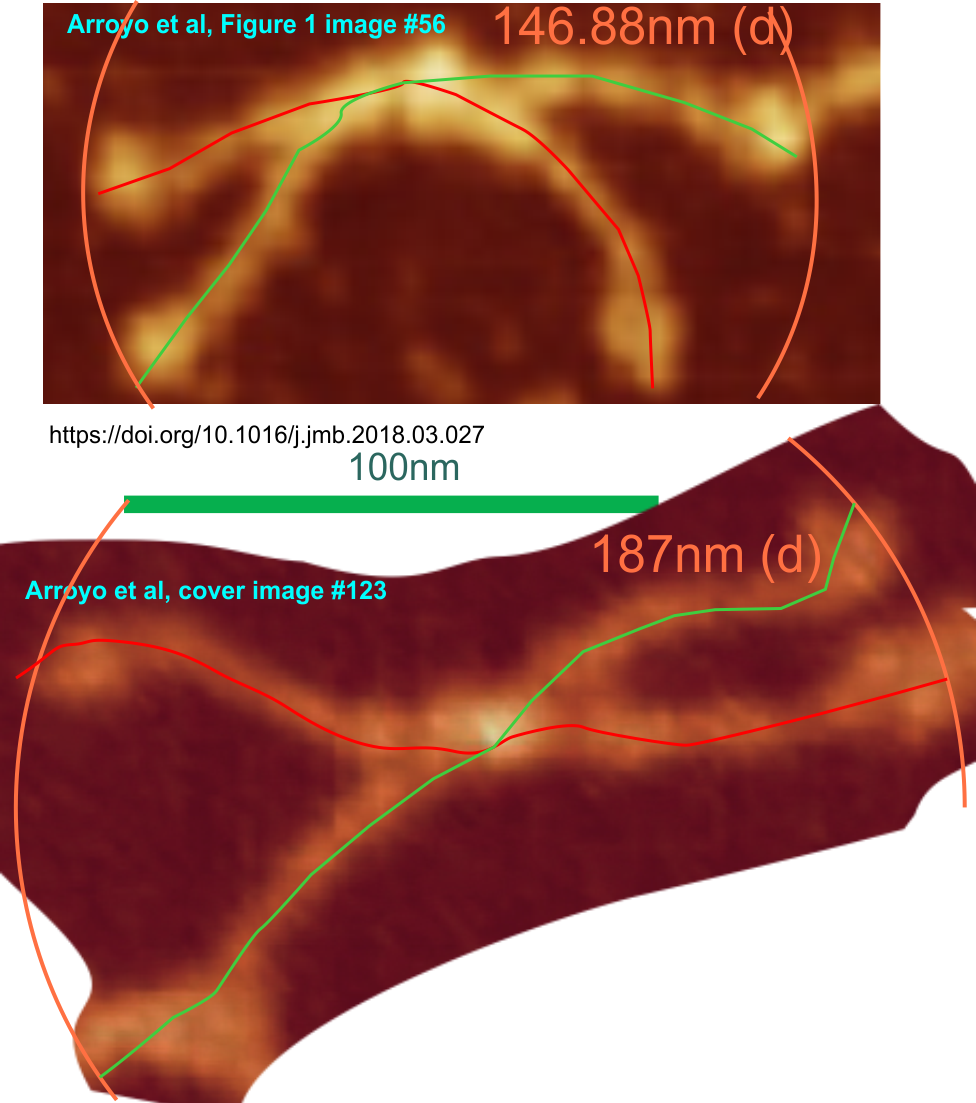
I have tried quite hard to figure out why there is a discrepancy (about 122% larger) in the size of the surfactant protein D dodecamers (well all species of SP-D molecules) in the cover image (which is stated by JMB cover description to be 1micron as the bar marker – total relative width of the micrograph) but which when calculated on individual selected out dodecamers is off by considerable amounts…. much larger. I redid this at least three times thinking i was making an error but i am pretty sure that the cover image micron marker (in the text) is not correct.  This makes it a little harder to explain when I return all dodecamers to a standard size (to be determined yet, but somewhere around 145 – 150nm from the tip of the CRD on one arm to the tip of the CRD on the other side.  If anyone out there is listening or has an explanation… please advise. Image below (top dodecamer) shows a dodecamer from their figure 1 measured with the bar marker for that image, and the bottom dodecamer is excised from their cover image and sized with the magnification given in the cover text.


Cutest infomercial song ever — Monty Python galaxy song

Kudos to the writers of these lyrics and melody (you can probably find the melody online but here is an updated more tame and hopefully accurate scientific version) and cute animation too.

Whenever life gets you down Mrs. Brown
and things seem hard our tough
and people are stupid obnoxious or daft
and you feel like youve had quite enough —
Just remember that you are standing
on a planet thats evolving
revolving at 1,000 miles an hour
Its orbiting at 19 miles a second
as its reckoned
a sun which is the source of all our power.
The sun and you and me
and all the stars that we can see
are moving at 12 million miles a day
In the outer spiral arm at 40,000 miles a hour
of the galaxy we call the milky way.
Our galaxy itself contains a 500 billion stars
its a 100 thousand light years side to side
it bulges in the middle 6 thousand light years thick
but out by us its just 1,000 light years wide.
We are 30,00 light years from galactic central point
we go round once every 200 million years
Our galaxy is only one of millions and billions
its an amazing and expanding universe.
The universe itself keeps on expanding and expanding
In all dimensions it can whiz
as fast as it can go, the speed of light you know
12 million miles a second and thats
the fastest speed there is.
So remember when you are feeling very small and insecure
how amazingly unlikely is your birth.
And pray that there is intelligent life
somewhere out in space
cause its bugger all down here on earth.

Love this list

Geometric values all related to DNA according to wikipedia, and a cute hand drawn diagram.
For each base pair, considered relative to its predecessor, there are the following base pair geometries to consider:

Shear: a force acting in a direction parallel to a surface
Stretch: a one-way stretch
Stagger: an eclipsed conformation is a conformation in which X and Y on adjacent atoms A, B are in closest proximity, implying that torsion angle X–A–B–Y is 0°.
Buckle:
Propeller: rotation of one base with respect to the other in the same base pair.
Opening:
Shift: displacement along an axis in the base-pair plane perpendicular to the first, directed from the minor to the major groove.
Slide: displacement along an axis in the plane of the base pair directed from one strand to the other.
Rise: displacement along the helix axis.
Tilt: rotation around the shift axis.
Roll: rotation around the slide axis.
Twist: rotation around the rise axis.
x-displacement:
y-displacement:
Inclination:
Tip:
Pitch: the height per complete turn of the helix.
I will work on a diagram that is an improvement over the one found on wikipedia.

Utterly disappointing LUT plots of TMV

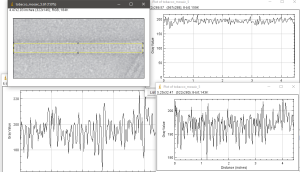
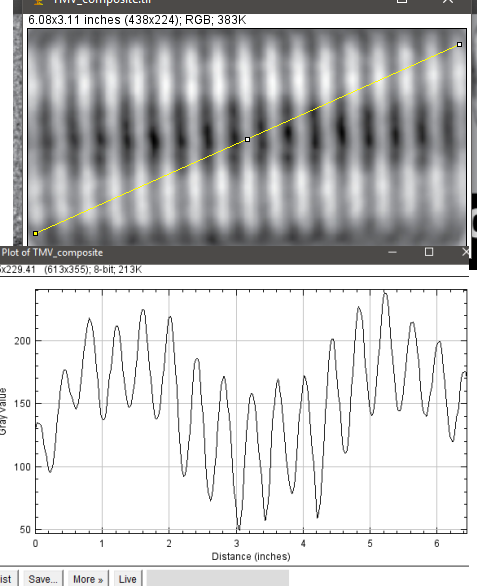
There were some really outstanding images of negatively stained tobacco mosaic virus in this publication. While reading the materials and methods it was like a throw-back ten years to staining grids for TEM.  The disappointing part is not with their images but in my trying to use ImageJ to plot out the very obvious patterning, and the central “hole”, but this did not happen.  Upper left is their TMV image (screen print), and three plots, one central line, lower left, one line at the edge of the structure, upper right, and one rectangular selection, lower right and also shown as the yellow-rectangle in the upper right image,  in ImageJ.

Since the pattern is so obvious, i expected something much more informative in the plots.

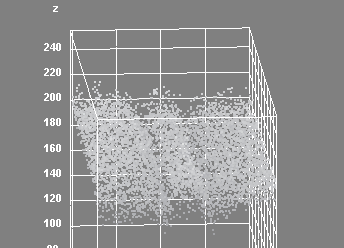
Interactive surface plot in ImageJ shows up center much better.

The best plot is perhaps the angle line drawn over their composite TMV image.

GIRTGIQ

GIRTGIQ – sequence in C1q to which is attributed the “kink” in the collagen like domain of C1q (Pfliegers et al) . They write “The two following interruptions in the Gly-Y-Z triplet repeats are involved in the kink of the collagen-like region,i.e.the insertion of a threonine at position 39 in the A chain and the replacement of a glycine by an alanine at position 36 in the C chain”. Also they suggest three lysines (58,59 and 61in A,B and C chains) along the collagen-like domain are likely where interaction sites with C1r and C1s proteases becoming the C1 complex. Their pictures are wonderful.