Category Archives: Ultimate order, the cell

The beauty and order of life is astounding.

Comparison of LUT plots for dodecamers of SP-D

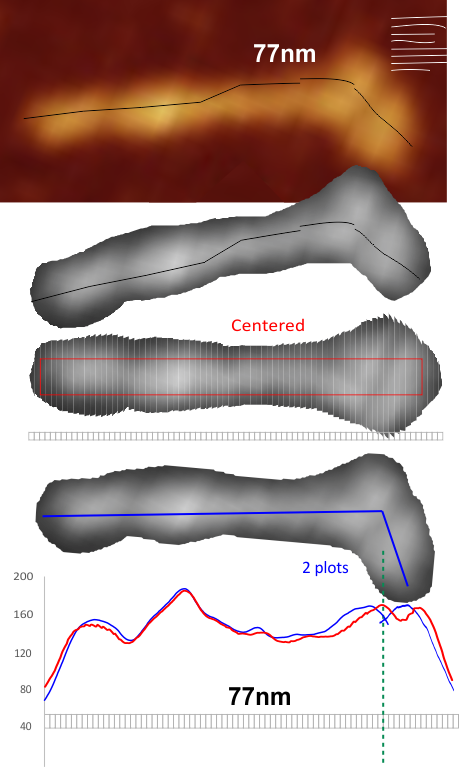
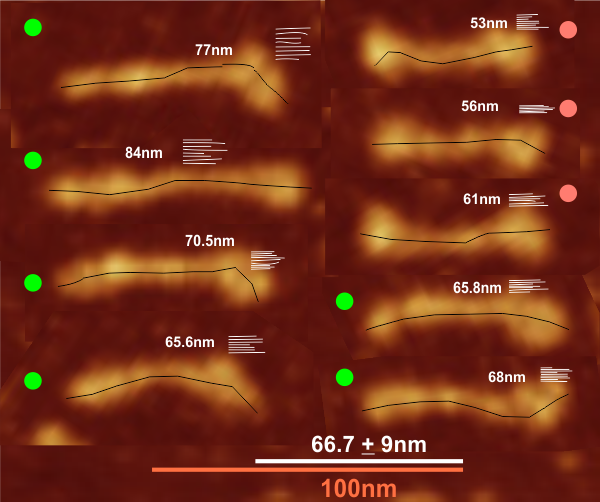
Comparison of LUT plots for dodecamers of SP-D seemed like a worthwhile test before going further on measuring the multimers and the trimers and the hexamers for peaks and valleys in grayscale.

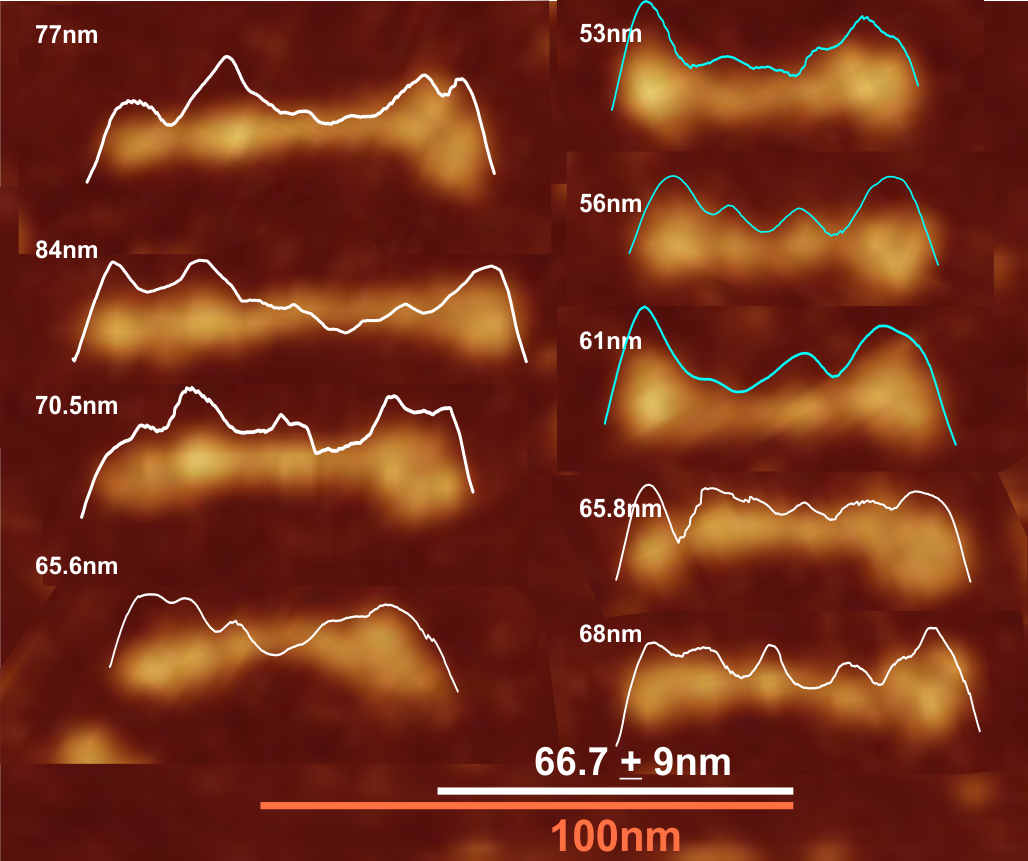
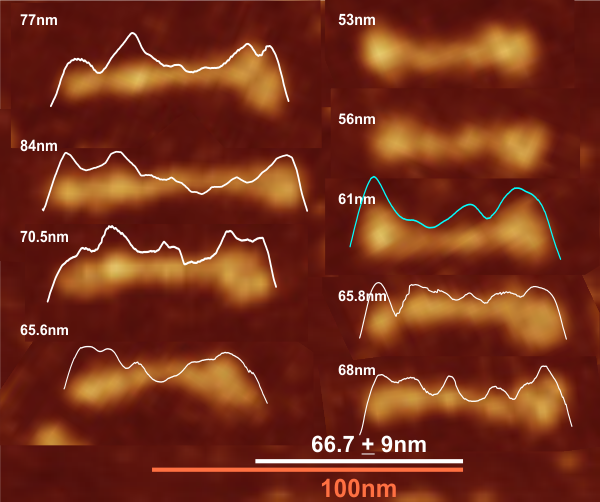
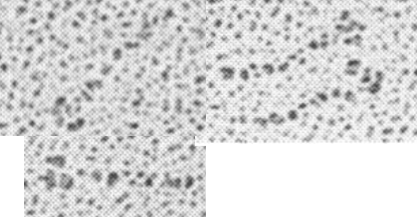
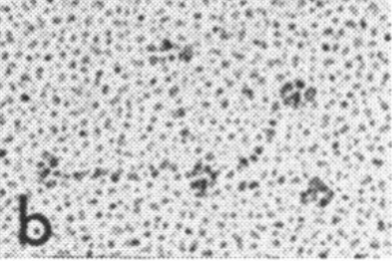
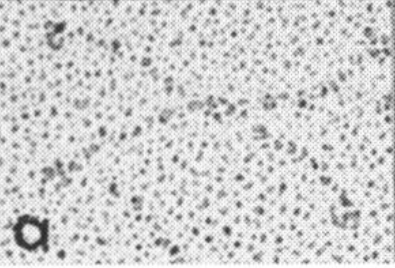
So i picked on of the dodecamers that I though was clean and informative from a higher mag AFMicrograph and compared it at the same (as best as i could from the measurements on posted images (low res image coming from Hartshorn et al, 2008) to see whether the fuzzier and lower contrast image would produce the two main peaks plus three intermediate peaks in each arm of the dodecamer. (main central peak is combined from the Ntermini of two trimers or 4 trimers or many trimers in a fuzzyball – i don’t think it is certain yet whether the multimers are made of just hexamers or dodecamers or both).

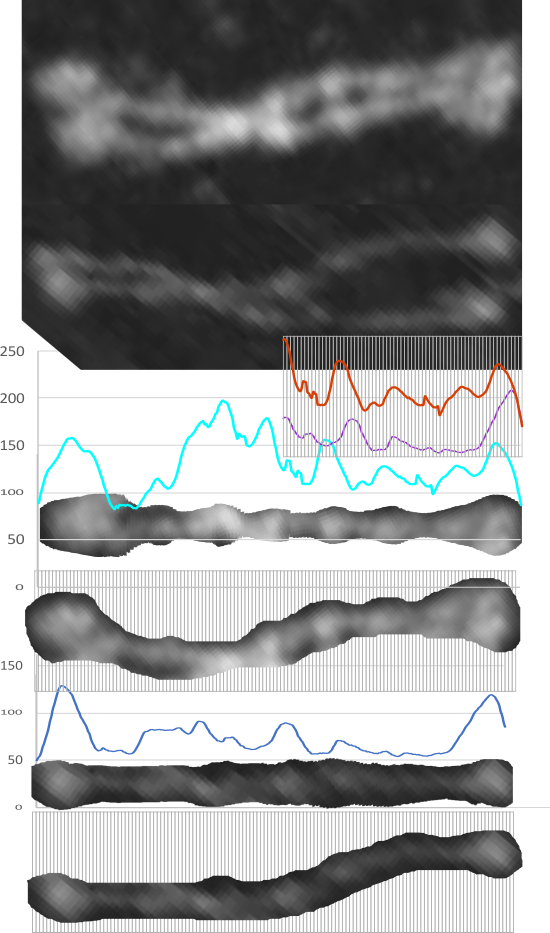
But as you can see from LUT plots (using ImageJ) isolated straightened arms of these two dodecamers can be easily seen as pretty similar.  The one from the higher mag image is much nicer, but data are still present in the low mag image. So that is kind of nice since i can still use those to add to the dataset on positions and incidence of intermediate LUT peaks between the Ntermini and CRD.

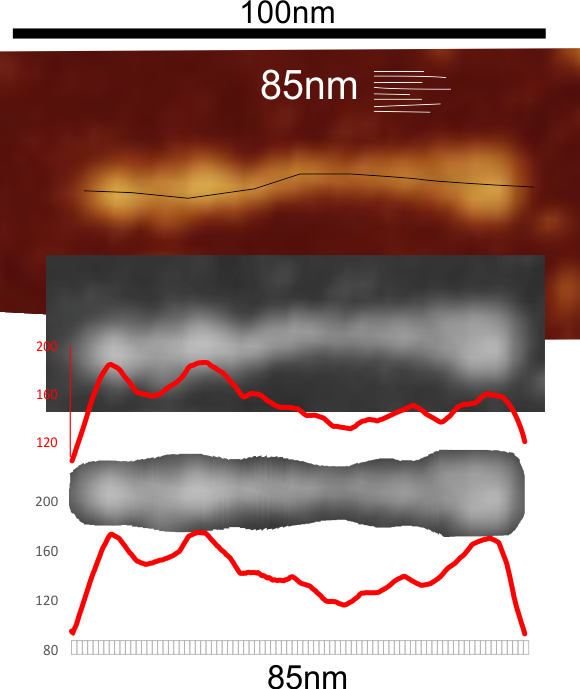
Plots adjusted for half width are just under the copies of the two AFMicrographs…. best res on top, lowest res on bottom of that top image. and beneath that the adjusted best half LUT plot for each orange and purple respectively.  The first peak in the collagen-like domain is very very constant, also prominent. Staggered connections (as would be the Ntermini) are common in biology, especially the structural proteins.

LUT plots for SP-D trimers (n=9)

LUT plots for SP-D trimers (n=9) all from same micrograph. There is some difference in my own perception of three top images on right hand said… something missing in the Nterminus region of the images. Finding out the width in nm of the left side (Ntermini) of these images can be done, but where to draw the line for the margin of each peak is a little bit subjective. (Image from Arroyo et al).
This image is the same as previous plot with the top two right plots added. Those LUT plots which show a “togetherness” of Nterminus and first part of collagen like portion are in blue while those plots in white have a distinct peak which corresponds to the first portion of the collagen-like domain.

From a different photo in this article there are trimers which have been exposed to pH (4.2) and heat (45oC) which still to me have a similar LUT plot pattern (which I will do) to those not heat and pH stressed.  There are a couple however which do not show enough definition obtained with AFM (at least in their image (not posted here, but will post) image) in the CRD to distinguish it from the Nterminus.
Seems kind of interesting to speculate that the structure of hexamers of SP-D tend to make “v” shapes where there are two arms on either side of the point of the V…. which would indicate that dependent upon pH the fuzzyball might actually have side to side attachments of the Nterminus, thus corroborating the “empty” dark (low brightness or luminance) of the center of some fuzzball images. (low pH in some disease states)

LUT plots for several SP-D trimers

Two peaks in the longer trimers at the Nterminus and first portion of the collagen like domain (trimers with white LUT plots over the exact image), but just one in the shorter trimers where it could be that the Nterminus and first portion of the collagen-like domain have become one peak. (blue LUT plot). Ntermini are on the left, CRD are on the right of each image. See the direction of the line segments used to determine the total length of the trimers that were curved on previous blog post.

LUT plots for SP-D trimer, with and without bends

It is clear that when TEM preps are made that not everything lies down on the grid in perfect orientation and without blemish or wrinkles. The mess that comes with looking through the microscope is not going to change much, it behoves us to make use of the visual cortex of the mind while waiting for AI to become more sophisticated at recognizing shapes and grayscale.

So SP-D trimers (from a picture by Arroyo et al mentioned countless times) are not all the same length (some folding over or back or side to side -probably at the N terminus) and not always the same thicknss (shrinkage and or slight perspective in depth) direction of the cantilever in AFM, and they are not all the same spectrum of grayscale (either 0-250, 1-256, or 1-100%  your choice).

The trimer length measure below by discontinuous lines (to accommodate the bend) and images converted to 300ppi grayscale, and those grayscale images exported to RGB tiff files to import into image J.  One image as you can tell has been cut into 77 pieces, which should equate to about 1 nm  each. Those slices were centered and the image exported to tiff for LUT plots using ImageJ.  (too bad the irregular polygon select tool wont plot in imageJ  haha..). The other image was analyzed in 2 plots, one along the straight part of the arm, the other along a straight part of the arm rotated. Two plots were scaled the same and just cut and pasted into the first plot.  Red rectangle and red plot line are from the centered image, while blue is from the plot from two areas, aligned at the matching plot indices.


It is pretty clear that both methods produce similar results, the former is perhaps easiest.

Bottom line for this particular SP-D trimer appears to be that Nterminus is a separate peak (albeit about half the height (lightness) of a hexamer or dodecamer) ) which suggests that maybe there is side to side binding (end to end would create TWO PEAKS WHICH ARE CERTAINLY NOT SEEN.


SP-D trimer arm length from AFM images

Trimers of surfactant protein D gathered from a single image produced by Arroyo et al have been lined up and measured by discontinuous lines sums (to accommodate the curvature of some of the molecules). CRD are on the right hand sides of each of the 9 images, Ntermini on the left. It is clear that the 5-peak grayscale (LUT plot) motif is present on those images with a green spot but not really present on the images with the pink spot — where the Nterminus and the first part (peak) of the collagen-like domain appear as a “bent” or “scrunched” bright (in terms of grayscale) area and they are also significantly different (n=3 56.66nm+/- 3.23 vs n=6 71.82nm +/- 6.6, p=0.008). The selection looks biased (and is) but is based on the number of bright peaks perceived by naked eye. I will plot each and see reevaluate in next post. Also the shortest set have a greater brightness indicating greater height in AFM.

Another interesting thing is that the Ntermini in the trimers is NOT the brightest peak (which it is in all the multimers above that (hexamers, dodecamers, fuzzyballs) and this to me means that there is a side-to-side attachment of the Ntermini… but which looks different than the CRD’s obvious 3-lump images, it looks more like an overlapping splice joint  rather than half lap or side to side joint.

LUT tables on a classic-looking SP-D trimer

This surfactant protein D trimer is from a publication by Arroyo et al, and the purpose of my measuring their image is to determine whether the Ntermini of SP-D multimers is created by side to side Ntermini connections, or end to end (i think most likely the former). I am measuring trimers and hexamers to see whether in the same micrograph (super important that they be from the same image since i have found wide variation in the micron bar markers and SP-D molecules in their respective images, and have on the whole decided that 100nm is not what they really — but have found the biggest discrepancies are in estimating the trimers and hexamers which are larger than expected. Nterminus is on the left, CRD is on the right.

so here is a “classic pattern found in lightness (brightness or grayscale) with Nterminus with collagen-like domain peak 1, 2, 3 and with possibly a 4th peak (maybe the coiled coil neck) and a very typical lumpy CRD.  These two LUT plots were from an unstraightened trimer using a single line (in ImageJ) and the plot below was using that same image cut out, then centered, and then exported and analyzed for grayscale using a rectangle.  It is easy to see that the accuracy of the plot, particularly in the CRD region where the three separate CRD are actually visible as rounded lumps on the C terminus end of the trimer.
\

So tip image, is their micron marker measurement, and their original image, my grayscale export to tiff and the line plot from ImageJ, made to measure what 85nm that their micron bar says it is.   Lower image is my trimmed, and cut into 1nm slices, centered exported to tif then analyzed in ImageJ to provide the LUT plot below.  The bottom is the smoothest and hopefully the most informative.   It is fair to say that this particular trimer is longer than the others in this micrograph, which means to me that something scrunches up on itself when not paired with another trimer.


Is this hexamer showing side to side N termini bonding

One question about SP-D fuzzyball multimers is whether or not the trimers, or hexamers or dodecamers only have N termini binding end-to-end making the diameter of the multimer about 120nm or whether it is possible that is there another configuration. SP-D multimers with fewer arms (maybe less than 12 or 14 often show a lucent (NOT MEANING luminous but the opposite, as in darker center… like electron lucent in TEM where there is a more background grayscale than a high level of “lightness” or “brightness”. This is what I have seen in multimers of SP-D of low arm count and I am trying to figure out a configuration of the multimer that satisfies this arrangement. In an image of a hexamer (Arryoy et al) there is one which really speaks to the possibility that N termini can bind side by side. Granted, Arroyo et al manipulated the pH of the preparation, but pH changes would occur in vivo in surfactant and other fluids as well, and might just be a trigger for fuzzyball formation that has arms that do NOT span the center N to end of Ntermini, but create a center hollow area with N to side of N binding.
Here is their picture…. N termini are the brightest portion on the lower part of the image. I did not ask for permission to repost this image but thank them.
and a cut and paste model from the above and a SP-D multimer from the same micrograph.  Aside from the butt and feet look

Arm length of SP-D, conglutinin, CL-43

Holmskov et al published images of CL-43 and SP-D and conglutinin prepared in hopefully all in the same manner of rotary shadowing technique and magnification, and i took each of those trimeric arms measuring them separately (using a line with sufficient numbers of nodes to account for the curvature of the molecules, from the edge of the CRD to the center (presumably the N terminus).  The arms of SP-D dodecamer were each measured and a mean found, similarly for conglutinin, and 4 individual arms of CL-43 taken at random from his picture (60nm, 47nm and 46nm respectively).  The micron marker is hopefully accurate, and it does then show a difference in arm length with each trimer of SP-D at about 60nm (making the dodecamer about 120nm in diameter) the conglutinin arms individually at 47nm, the full diameter at 91nmn, and the CL-43 very close to the conglutinin at 46nm (no dodecamer found in his image). (you can see his figure numbers still on the unretouched images).

So a really easy way to measure the length of a curved c-type lectin arm (including bends and kinks) is to create a vector line with nodes at places which accommodate the shape (this is a different method than calculating the arc angle and arc length that I tried previously. This is quite easy by comparison. This group published a diagram with relative sizes here  as well which also has micrographs accompanying, maybe some of the same images – i will check and measure. I know at one point i did not agree with the length of the collagen-like region, and had difficulty matching that with the AFM images produced by others.  His diagram of the AA sequence size comparison i have posted before, but include at the bottom.  THey are pretty close to what i measured. Relative to their SP-D being a single trimer of 60nm in adjusted length (adjusted for curvature) then the CL-43 is 46nm as a single trimer – exactly what his diagram would suggests (if SP-D is 60nm, then CL-43  is 47nm),

Images below


From Hansen and Holmskov (Immunobiology, 199, 1998)

Astounding inaccuracy in a scientific diagram of surfactant protein A

Remember playing “telephone” as a kid (also called “chinese whispers” — the title of which in and of itself denotes confusion)? Here is a link to wikihow if you never played it. The purpose is to show “in real life” what happens when information is casually passed from one to another (as in gossip… and i am calling the remake of scientific illustrations from previous publications as a similar phenomenon).  The important truth is that information is easily corrupted. No more description is needed for the image below which is supposed to portray surfactant protein A.  Clearly this artist/scientist team knew very little about SP-A or they were playing “telephone” with the specifics of how to draw the diagram.

What is sad to me is that this really bad diagram shows up in a place where many individuals might actually expect accuracy (a site called Global Science Books ) ? A link to the pdf that I found is HERE.

I will list what I think they missed, data from SFTPA1 online and the literature.

  1.  The ratio of AA for each of the 4 domains seems to be wrong, as the N terminus is very short, the collagen like portion is pretty long (blue), coiled coil neck domain (black) is not too long, the CRD (red) is quite long.  The relative distances of these four domains in this diagram are quite far off, in spite of the fact that many much better diagrams are available for free. Signal peptide is 1-20.
  2. Where did the third strand of the collagen-like domain go? It looks to me like the two twined black lines in their diagram are just that “2” not “3” as repeatedly mentioned in texts (every text i have read in fact) and why would it be called a trimer if not three, and how in the world does the third CRD domain hook up when there is no line in the collagen like domain to which to attach it?
  3. There is virtually no distinction between the winding of the collagen-like domain and the coiled coil neck… an arrow points to the transition, but there is not definition, and as well, there are only 2 of the 3 strands in the neck domains present.
  4. It is difficult to interpret the trunk like portion of this diagram, and how it might relate to the interactions between the collagen like domains, of the 6 trimers. It might be noted that in their diagram (not shown here) lying right next to this SP-A diagram shows the dimer of SP-B in the same two lines as the trimer of SP-A? Why?
  5. What in the world are the “balls” circles at the N terminus? Is this a depiction of N termini binding sites?
  6. Why are the three supposedly nearly (if not absolutely) identical CRD pictured in different sizes?. If it is an attempt at forshortening in graphic design if fails miserably.

OK, this is enough, you get the point.


Mini SP-D Ntermin and arm length and angle

Mini SP-D Ntermin and arm length and angle are quite close to measurements shown for images of SP-D by numerous authors. This little SP-D dodecamer image is from a publication by White et al, J Immunol 2008 and is described as having C3 and C4 of the collagen-like domain removed (these would be equivalent to the two lateral inbetween peaks that show up on LUT tables of AFM images of h and rSP-D and graphed a zillion times on this blog site.

In this case It is just noted that the central portion of the miniSP-D dodecamer is not that different from that of the full SP-D shown in other publications (rat mouse human). By the bar marker in this publication the rSP-D dodecamer is about 130nm from CRD to CRD on the opposite side. The miniSP-D is about 62nm from CRD to CRD on the opposite side, the center portion (the two N termini) of the mini-SP-D is about 22nm measured proportionally in reference to the estimated total width of the mini-dodecamer. This particular image is really interesting as well because if one looks closely at the “shadowing” and as i did, take the original 72ppi image and increase it to 600ppi then use a gaussian blur then the shading (shown below) is really beautiful and even demarks how the 2 N termini might come together side by side, rather than what I sort of guessed would be end to end.  Side to side N termini would explain a couple of things: 1) the width and height of N terminus peak in AFM images, and the presence of central “holes” in fuzzyballs (seeing as the side to side N termini binding would allow for V shaped association and then alignment in a circle or sphere with a cantral cavity.

In addition the arm angle of rSP-D (unmodified) is about 48o and is really close to the angle measured in the 10 shadowed images for miniSP-D shown in White, et al’s publication (see image just below).

.

Add to that a cutout of an image with greater pixel density and a line drawing of two potentially Nterminus to Nterminus in side attachement, and the shading (not mine or photoshopped shading but actual shading from the original micrograph) in clarity the 3 CRD at the ends of the mini SP-D trimers (all four arms and their 12 heads), the thin adjacent peak (as lightness close to 100% or lumance close to 250) which is probably C1 portion of the collagen like domain, and perhaps C2, and the absence of the stretch of C3 and C4 as predicted in the publication by White et al listed above. It would be great to have some AFM images, though this shadowed image is really nice. it might just be chance (maybe it is likely just chance) that the shadowing looks 3D and this is based upon the fact thta the shadoe cast images for SP-D (full size) in the same paper just does not show the detail that is  seen with AFM…. it does show other detail better however (like arm width).