Just working to keep my sanity. Here is a counted cross stitch of a virus particle in blues and yellows. Just ask for it or find it HERE. Be well, mm

Category Archives: Science and art cover illustrations
Taking the stress out of our current pandemic with cross stitching
made this counted cross stitch pattern of the coronavirus… find the pattern really cheap here, and help relieve some of your stress as you stitch it

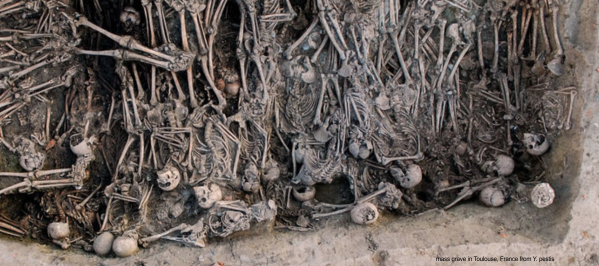
Hauntingly beautiful?
It will seem odd to most but i find this image as beautiful as any abstract art I have seen, and so deeply moving. We are nothing more than iterations, repeating stanzas; cut and paste; carbon copies — all of us. See original image here.
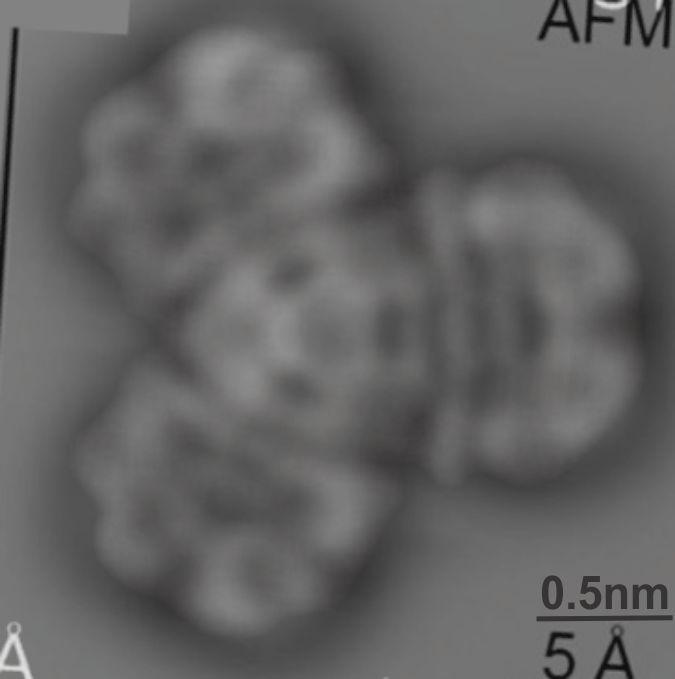
Lovely AFM image – would love to see this of SP-D
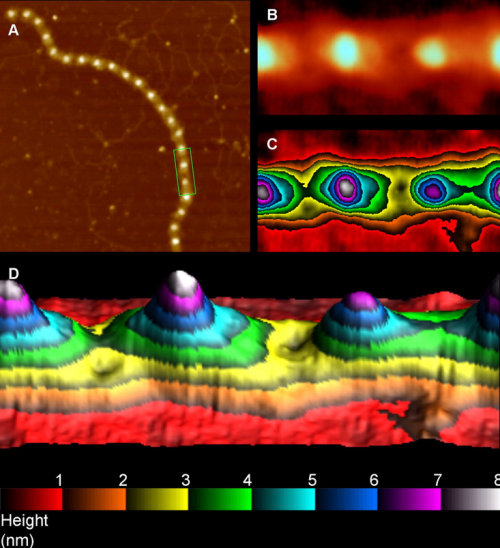 These guys have a great image, just would love to have the images and softward to do this for a SP-D fuzzyball (SP-D multimer).
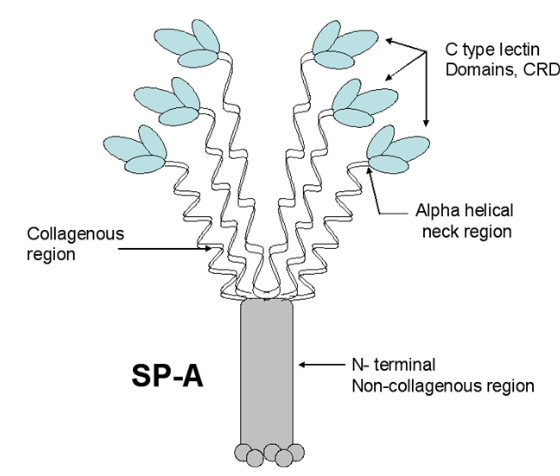
Astounding inaccuracy in a scientific diagram of surfactant protein A
Remember playing “telephone” as a kid (also called “chinese whispers” — the title of which in and of itself denotes confusion)? Here is a link to wikihow if you never played it. The purpose is to show “in real life” what happens when information is casually passed from one to another (as in gossip… and i am calling the remake of scientific illustrations from previous publications as a similar phenomenon). The important truth is that information is easily corrupted. No more description is needed for the image below which is supposed to portray surfactant protein A. Clearly this artist/scientist team knew very little about SP-A or they were playing “telephone” with the specifics of how to draw the diagram.
What is sad to me is that this really bad diagram shows up in a place where many individuals might actually expect accuracy (a site called Global Science Books ) ? A link to the pdf that I found is HERE.
I will list what I think they missed, data from SFTPA1 online and the literature.
- The ratio of AA for each of the 4 domains seems to be wrong, as the N terminus is very short, the collagen like portion is pretty long (blue), coiled coil neck domain (black) is not too long, the CRD (red) is quite long. The relative distances of these four domains in this diagram are quite far off, in spite of the fact that many much better diagrams are available for free. Signal peptide is 1-20.
- Where did the third strand of the collagen-like domain go? It looks to me like the two twined black lines in their diagram are just that “2” not “3” as repeatedly mentioned in texts (every text i have read in fact) and why would it be called a trimer if not three, and how in the world does the third CRD domain hook up when there is no line in the collagen like domain to which to attach it?
- There is virtually no distinction between the winding of the collagen-like domain and the coiled coil neck… an arrow points to the transition, but there is not definition, and as well, there are only 2 of the 3 strands in the neck domains present.
- It is difficult to interpret the trunk like portion of this diagram, and how it might relate to the interactions between the collagen like domains, of the 6 trimers. It might be noted that in their diagram (not shown here) lying right next to this SP-A diagram shows the dimer of SP-B in the same two lines as the trimer of SP-A? Why?
- What in the world are the “balls” circles at the N terminus? Is this a depiction of N termini binding sites?
- Why are the three supposedly nearly (if not absolutely) identical CRD pictured in different sizes?. If it is an attempt at forshortening in graphic design if fails miserably.
OK, this is enough, you get the point.
IS THIS Luminance? or LIGHTNESS? how to define 1-256 in terms of atomic force micrographs
Luminance: This is a basic question – that is how to define (label and measure) the brightness or luminance or luminousness of the various greyscale portions of micrographs. This is a question for morphometry – presumably outside the image and photograph world?
Various definitions, interpretations, ideas, statements are given freely on the internet — but how does one really define the brightness – or height of bright areas defining molecular structures in the digital signature of atomic force micrographs. I am looking for some reasonable way to quantify the brightness (in terms of grayscale pixels with a 0 – 256 level) of images of surfactant protein D. (these fun images show luminance and chrominance). It will be the pervue of artificial intelligence (as the technology becomes suitable for scanning large numbers of microscopic fields and “learning” how to classify organelles and molecules.
1. Here we have one definition: Luminance is then a simple function of the number of photons of the specific wavelength interval (corresponding to red, green, or blue) that the pixel receives This means that color is obtained by merging the luminance values from adjacent pixels using computational algorithms, in a process that is called compositing (Fig. 5.2). I am considering this irrelevant to greyscale.
2. And another definition: To measure the total radiation, which includes both reflection and emission of an area receiver, a photometric measure called the luminance is used…. in the same URL, also to quantification of greyscale in micrographs.
3. And from an additional article from science direct: Luminance and Contrast —Luminance is defined as the intensity of light from the visible spectrum per unit area traveling in a given direction (usually expressed in candelas/meter2 [cd/m2]). I dont really like this definition for greyscale either since i don’t see anything traveling in any direction (haha).
4. And a very simple definition: the state or quality of being luminous. Also called luminosity. The quality or condition of radiating or reflecting light: the blinding luminance of the sun. Optics:the quantitative measure of brightness of a light source or an illuminated surface. The brightness might also be called lightness. If the definition of HSL is as follows:
Hue is a degree on the color wheel from 0 to 360. 0 is red, 120 is green, 240 is blue.
Saturation
Saturation is a percentage value; 0% means a shade of gray and 100% is the full color.
Lightness
Lightness is also a percentage; 0% is black, 100% is white.
The only adjustment here is that greyscale of 0-256 would have to be converted into percent black being 0 and 256 bing 100%. This actually might be a good way to control for the difference in contrast in different micrographs. I will give this some tests…. because it occurs to me that when I plot the LUT using Image J one would be advised to fix a given beginning and end, maybe a small gradient map to each plot to the allow that the different in contrast to be normalized.
5. And from Google: Luminance is a photometric measure of the luminous intensity per unit area of light travelling in a given direction. It describes the amount of light that passes through, is emitted or reflected from a particular area, and falls within a given solid angle. The SI unit for luminance is candela per square metre (cd/m2) — also clearly irrelevant to finding an internal standard and name for greyscale plots.
So in a sense the luminance (which I have assigned to a scale of 0 – 256) would be a digital value of the amount of light reflected “reflected” in quotes, and registered by ImageJ in an arbitrary scale. Further, since there is no color in these images (converted to greyscale by me sometimes, and sometimes by the authors of the publications), then “chrominance” ,which apparently is a real word, does not apply, and luminance is just a matter of “brightness”. The use of what is currently in the literature would possible be HSL. Hue, saturation and lightness.
6. and who knew Brightness was subjective: and i quote “Luminance is the luminous intensity, projected on a given area and direction. … Brightness is a subjective attribute of light”
7. This group has chosen to use a second descriptor: luminance factor. [′lü·mə·nəns ‚fak·tər] (optics) The ratio of the luminance of a body when illuminated and observed under certain conditions to that of a perfect diffuser under the same conditions.
8. so perhaps Luminousness is a better term. Luminous has a very simple definigion — means full of or giving off light: suggesting here the words “digital luminousness” haha… perhaps that is too hard to say fast, many times in succession.
So one must conclude that some qualifier of the word luminance is what needs to used when describing the relative “lightness” or “brightness” in greyscale in morphometrics of organelles and objects in a micrograph.
This plot (below) then is an attempt to find a way to quantify tip height in AFM, and uses greyscale to do so, and also nm as a measure of length of the monomer. If you begin at the red area and see that it is about 14nm in width and total of 193luminance points in height it represents the center of the SP-D dodecamer, the N terminus (here just one side of the two that come together to form the dodecamer (only one monomer shown in this plot> Thereafter there are three or four (more often just 3) smaller peaks (a peak defined as a minimum distance from peak to valley of 9 luminance points (0-256) and then on to the last peak with is the carbohydrate recognition domain. The plot below is a summary peak-ness of the trimeric unit that makes up an SP-D dodecamer. 
I think i will try to use a square (17×17 px) greyscale standard at the beginning of all the LUT plots that i do, then in excel i can use the internal control numbers to try to control for variations in greyscale (contrast and lightness) in micrographs.
Tired of figuring out faulty scientific illustrations ?
The LAMP family is characterized by a conserved domain of 150 to 200 amino acids with two disulfide bonds. While reading this I looked up one of the references to see what they had pointed out as the morphological differences between endosomal membranes and lysosomal membranes and found this diagram in the publication linked here. While is seems trivial in a sense, it is not really, since visual depiction of facts 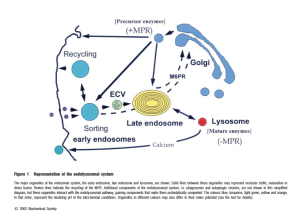 needs to be as accurate as verbal depiction of facts… otherwise it is “fake science news”. The diagram below goes against everything I have learned about cell biology…. with the arrow on the bottom pointing FROM the lysosome, TO the early endosome…. what? The early endosome is the beginning, by their own words statement the early endosome is created de novo at the cell membrane. So then I ask, why is the arrow not pointing in the other direction? and here is a quote “Endocytosed material tends to flow vectorially through the system, proceeding through the early endosome, the endosome carrier vesicle, the late endosome and the lysosome.” speaking to this subject.
Could not resist blending these AFM and STM images
The difference between AFM and STM has been explained to me before and there are a couple informative references online but I have not sufficiently studied their differences to understand why the images of the compound here…. also which I could not find a 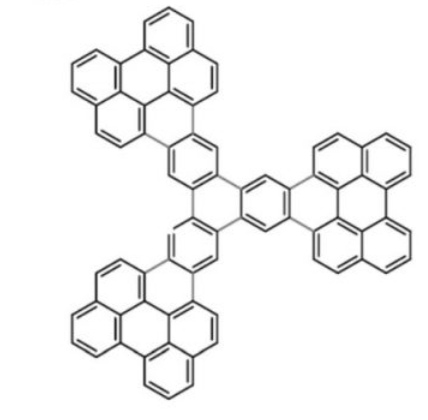 name for but is some kind of tri-dibenzo[b,ghi]perylene, or at least that what i guessed at. These two images, shown below, didn’t seem to look very much alike – measuring different parameters but I wanted to merge them into something that was closer to the line diagram above. Wich, lead to the image at the bottom.
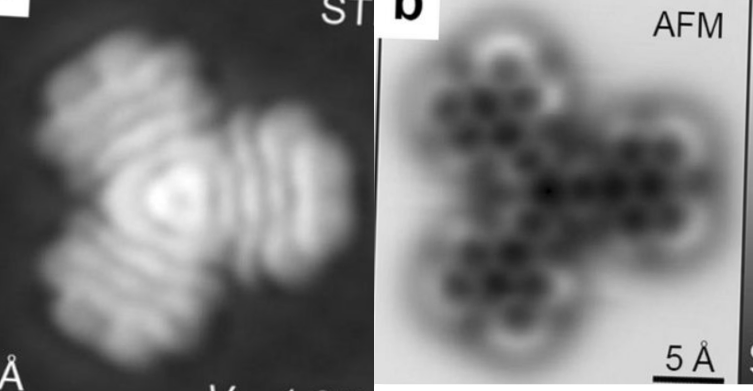
I guess this is a planar molecule since i think the testing has mostly been done on such, but you can see that this particular molecule merged shows a little bit of a different pattern on the right hand side than on the top and bottom portions on the left…. likely just slightly tilted. Sadly this makes no sense to me, but using both techniques at the same mag, and merging might help someone understand the differences in the two images.
I laugh, all this in the course of trying to find AFM of large protein molecules to test my imaging approach to SP-D.
Lots of trimeric molecules out there
I think there is something very basic about the way molecule fit together that is beyond simple, just convenient. Think about assembling 2 of something… there is almost always a long and short part, or four of something, then we have a hole maybe, especially if the object is slightly irregular in shape. BUT THREE, the magic number, slight turns and little twists and the sum of the three is much more than the numerical sum.
A little surfactant song: SP-D
MLLFLLSALVLLTQPLGYLE
AEMKTYSHRTMPSACTLVMCSSVES
GLPGRDGRDGREGPRGEKGDPGLPGAAGQAGMPGQAGPVGPKGDNGSVGEPGPKGDTGPSGPPGPPGVPGPAGREGPLGKQGNIGPQGKPGPKGEAGPKGEVGAPGMQGSAGARGLAGPKGERGVPGERGVPGNTGAAGSAGAMGPQGSPGARGPPGLKGDKGIPGDKGAKGESGLP
DVASLRQQVEALQGQVQHLQAAFSQYKKVELFPNGQ
SVGEKIFKTAGFVKPFTEAQLLCTQAGGQLASPRSAAENAALQQLVVAKNEAAFLSMTDSK
TEGKFTYPTGESLVYSNWAPGEPNDDGGSEDCVEIFTNGKWNDRACGEKRLVVCEF
(MLLFLLSALVLLTQPLGYLEAEMKTYSHRTMPSACTLVMCSSVESGLPGRDGRDGREGPRGEKGDPGLPGAAGQAGMPGQAGPVGPKGDNGSVGEPGPKGDTGPSGPPGPPGVPGPAGREGPLGKQGNIGPQGKPGPKGEAGPKGEVGAPGMQGSAGARGLAGPKGERGVPGERGVPGNTGAAGSAGAMGPQGSPGARGPPGLKGDKGIPGDKGAKGESGLPDVASLRQQVEALQGQVQHLQAAFSQYKKVELFPNGQSVGEKIFKTAGFVKPFTEAQLLCTQAGGQLASPRSAAENAALQQLVVAKNEAAFLSMTDSKTEGKFTYPTGESLVYSNWAPGEPNDDGGSEDCVEIFTNGKWNDRACGEKRLVVCEF)
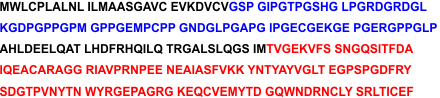
This is a sequence which i believe I have correctly identified as human Surfactant Protein D from van Eijk’s publication (https://doi.org/10.1165/ajrcmb.26.6.4520). ( Green above is the signal peptide, the blue is the N terminal, the black is the collagen like sequence with proposed gycosylation site in light blue beginning the 70th aa) and the purple the coiled coil neck, and the red the carbohydrate recognition domain.
This is pretty relaxing music in my mind…..and it was interesting to be able to hear the music quality change in each of the domains.
The very first part is quite melodic (signal peptic sequence and the N terminal domain. The coiled coil neck and the carbohydrate recognition domain are melodic as well….
The fun part is to try to identify the low “drone” of the “A” in the central part of this clip which represents the glycine amino acids and their recurring theme. This is in the collagen-like domain within the surfactant protein D molecule: on paper it is written usually as G x x which are repeats: a glycine, then another amino acid, and another, and then back to glycine…. )
It would be interesting to line up similar order of tones for a collagen molecule to reinforce the importance of the “drone” in identifying the collagen-like domain.
I didn’t not invent a really good way to assign the single letter codes for the amino acids that match notes on the 12 tone scale, so I just listed the amino acids sort of alphabetically. as is done in many text books and publications. There would be other ways to assign pitch, on charge and hydrophobicity or hydrophilicity, or some other property, that would be informative, and might work as a second or third track. One could list those with letter assignments that match the piano scale using the duplicate first letters, e.g. alanine, argenine, asparagine, aspartic acid in different octaves but that is also just arbitrary… the more intelligent thing would for me to have arranged them according to physical properties rather than random.
And while it looks like a waste of time…. It helped me memorize the single letter nicknames for the 20 amino acids …as well as hearing the differences in the variation in amino acids incorporated into each of the four domains of surfactant protein D, and reminded me of how to use FLStudio.