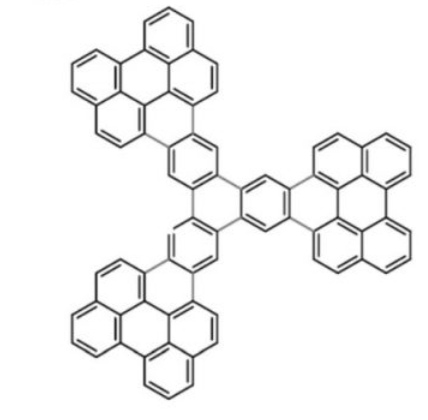
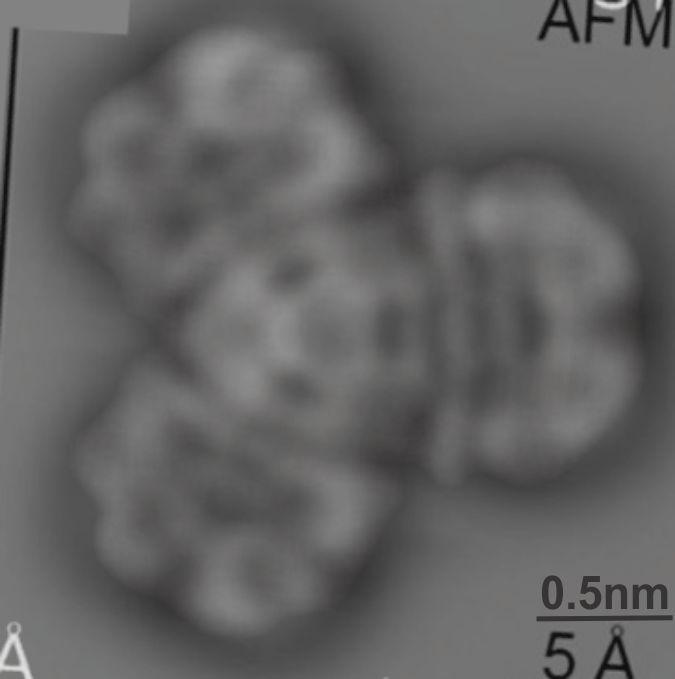
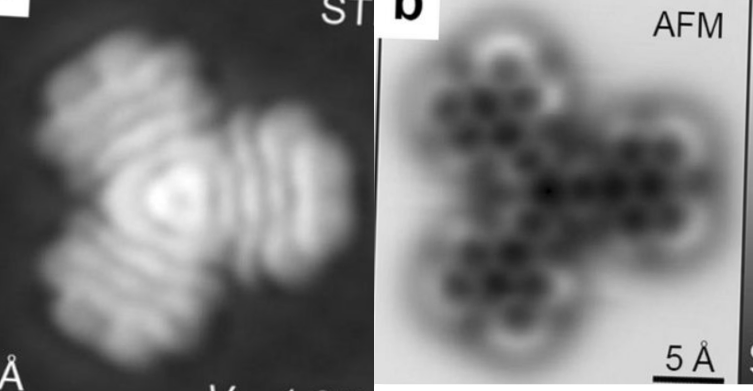
The difference between AFM and STM has been explained to me before and there are a couple informative references online but I have not sufficiently studied their differences to understand why the images of the compound here…. also which I could not find a  name for but is some kind of tri-dibenzo[b,ghi]perylene, or at least that what i guessed at. These two images, shown below, didn’t seem to look very much alike – measuring different parameters but I wanted to merge them into something that was closer to the line diagram above. Wich, lead to the image at the bottom.

I guess this is a planar molecule since i think the testing has mostly been done on such, but you can see that this particular molecule merged shows a little bit of a different pattern on the right hand side than on the top and bottom portions on the left…. likely just slightly tilted. Sadly this makes no sense to me, but using both techniques at the same mag, and merging might help someone understand the differences in the two images.
I laugh, all this in the course of trying to find AFM of large protein molecules to test my imaging approach to SP-D.
