Category Archives: Glutamate cysteine ligase catalytic subunit KO mice

electron micrographs of the Gclc ko mouse liver, cellular organelles apoptosis hepatocytes, liver cells ultrastructure

Awesome video from transmission electron micrographs

Here is an awesome video… loved it.  I was searching to find the approximate dimensions of clathrin… to see if a vesicle in one of my own micrographs possibly had clathrin protein… the distance between little spokes radiation into the center of the vesicle was approximately 60nm +/- 5nm  and I found this really remarkable movie.  And i also commend that it is freely shown, and very colorful.

At the same time I continue to find TEMs from some dude in Germany whose research was very likely funded with public funds there but who also seems so insecure that he needs to “tag” that property (belonging to everyone in the world and very likely paid for by government funds) as his own… what a small mind he has– totally small and self indulgent.

So here is the little structure I measured the proteins in….  maybe clathrin, maybe not. Measurements based on ribosome size in THIS micrograph assuming mammalian ribosome is about 27nm in diameter.   Distances between radial arms is about 60nm. Micrograph is from a 50 day wc/ii mouse. Black rays indicate location of inward projecting densities and distances between those lines at the perimeter of the vesicle were measured. A portion of a mitochondrion is on the left. Ribosome size is shown as red dot.


Mitochondrial interactions with RER

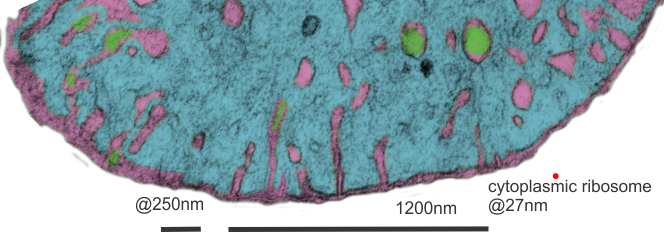
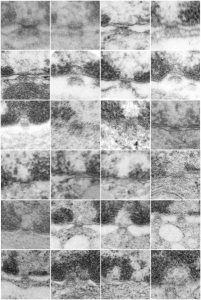
Hepatocyte here, GCLC ko mouse, shows the donut and irregular configuration that is common in circumstances where mitochondria are stressed (I personally have seen it several times but in unrelated experimental circumstances so it is probably a generic response mostly).  In this really opportune section one can see a mitochondrion (with an odd donut shape) ont eh left, and a section of RER which has been sectioned tangentially showing the closeness and absolute regularity of the ribosomes along a spiral of mRNA.

I bet at some point all information about these association and the proteins (i saw a list that mentioned in the 800s and counting) in the inner and outer and cristae membranes, and the cristae junctions as well as the matrix will be modeled.  Until then, circumstantial evidence for the power of the interactions between mitochondria and other organelles (and cytoskeletal proteins) has to suffice.

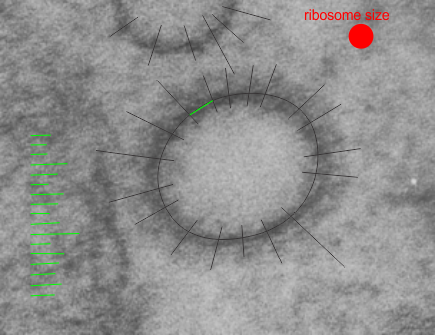
The ribosome spirals here look to have approximately 7.3+/- .47 (SEM) ribosomes per spiral, n=9 (a small sample but the best orientation, and a single micrograph…. so this is just a suggested number obviously.  19735_73218_#201 liver alb+/- Gckc -/- postnatal day 28. liver mouse, no NAC.

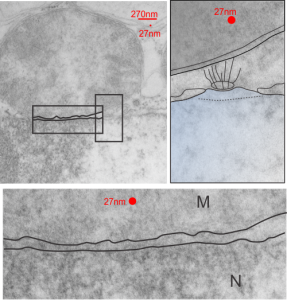
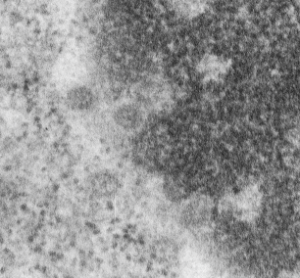
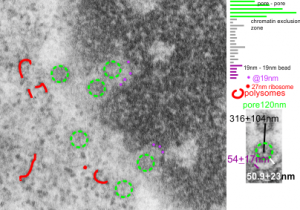
One thing abou these mice that is pneumonic is the dilated ER, a mix of smooth and rough, ribosomes spaced and the presence of the little bubble-blip invaginations of ER within the outer RER membranes.  These mitochondria also display fission lines and tubular cristae, and quite a bit of it.  Blue dotted line (outline of one part of a mitochondrion – that one tangentially sectioned beside the RER, white box, area for enlargement to the right. Upper image on right has cytoplasmic ribosomes in mRNA-spirals (orange) and lower image is contrast enhanced to highlight the spirals of cytoplasmic ribosomes.  I really don’t think there are any good examples of mitoribosomes in either of the two mitochondria shown here.

Numerous proteins in the outer mitochondrial membrane (encoded by nuclear DNA) target and or are attached to cytoplasmic ribosomes. Cytoplasmic ribosomes have been visualized on mitochondria membranes (that would be the cytoplasmic face of the OMM). These are suggested to be linked by the translocase of the (outer) mitochondrial membrane (TOM) and it is reported that the ribosomes are in clusters (Till Klecker et al, 2014 Trends in Cell Biology) and that pretty much looks like these nRNA-ribosomal spirals… tidily wound.

MDVs, mitochondrially derived vesicles (about 70-150nm) are  purposeful buds of membrane derived from mitochondria which are targeted to lysosomes, and maybe other organelles.

Just an “aside” here, but is it possible that the donut shaped mitochondria (invaginations, and extra turns and indents) might be somehow a deliberate attempt to increase surface area for interaction with other membranes.   Another question is the orientation of cristae.  I have looked for cristae pores, and that relationship…  just not seeing it overtly.

Isolated mitochondrion with smooth ER

A single isolated mitochondrion (blue)  and attached SER (pink) from a mouse at D28, likely isolated from liver,  postnatally having received NAC. This and other images were of controls for D28 mitochondrial pellets from hepatocyte specific GCLC ko mice also receiving NAC.  There is a lot of substructure going on at the attachment between the outer mitochondrial membrane and the SER membrane, and some tiny cristae right at that junctional tether. It is possible that a mitochondrial ribosome is in the field as well (dark dot rounded object in mitochodnrial matrix – middle right. (also there is a tiny piece of dirt, so dont be confused). So the periodicity between SER and mitochondrion seems to come out at about 35nm which is larger than I had hoped, but there is always the possibility that the structures were cut tangentially.

Mitochondrial cristae junctions and pores?

Searching through micrographs to determine whether or not i can visualize a mitochondrial pore or crista junction.  Here is a cutout of a border of a mitochondrion which looked to have several adjacent and more or less evenly spaced cristae along one outer mitochondrial membrane. None of these exposes a clear connection where an inner mitochondrial membrane space should appear. Also of note (in this experimental set of animals) there tends to be a narrowing at the base of the cristae, and a little ballooning of the remainder of the cristae bring. This might be a manifestation of the cristae junction. In a stretch of outer mitochondrial membrane about 475nm in distance there were 6 areas where the former and the cristae membranes meet.

In this particular mouse liver electron micrograph the animal was a hepatocyte specific ko for GCLC, specifically negative 18408 block 78375 wc/ii animal#5 and 50 days old. red dot=@27nm (one cytoplasmic ribosome) used as a micrometer.

mitochondria liver electron micrograph cristae junction
Looking at the matrix of this mitochondrion several densities appear which may be too small of mitoribosomes.


Another mitochondrion which i examined and pseudocolored the same those above, has about 1 cristae membrane junction pore per 250nm or so counted over a stretch about five times that long. Clearly, physical state (these KO mice) nutrition, gender, cell type and function which the mitochondrion is supporting.  Green is the inter cristae membrane space,  pink is the outer and inner mitochondrial membranes, blu background is the mitochondrial matrix. The tissue from which these sections were made was a ko, (conditional KO of GCLC in liver).

Crista junctions in mitochondria

I am trying to visualize crista junctions in mitochondria in the liver (mammalian). These might be visible here, in a KO mouse which has increased oxidative stress (previous posts). It looks to me like there is a small consistent area at the place around cristae approaching the outer mitochondrial membrane that looks “different”?  Find the 100nm markers (vertical at the edge of a crista and horizontal by the red dot over on the right hand side) are an approximate marker for the size of a cytoplasmic ribosome (27nm) and calculation for 100nm from that.

Cristae in this particular mitochondrion and many others show an increase in the amount of matrix space and a more vesicular type of cristae, and some times have cristae inclusions.

Mitochondrial and ER inclusions, and nuclear invaginations in Gclc hepatocyte specific KO mice

Hmm. Is there a possibility that the inclusions in the inter-cristae space of mitochondria, the inclusions sometimes seen in nuclei (probably invaginations), and the iron-like dense inclusions in the ER hepatocyte cytoplasm, are linked by enzymes that are involved in the maturation of cellular Fe/S proteins for which mitochondria are important. These images are from Gclc hepatocyte specific KO mice, one image (with the nuclear invagination with iron-like spicules upper left) came from a KO that was rescued with NAC the other two micrographs are from wc/ii mice, unrescued, at day 50.

Outer nuclear pore filaments and mitochondrial proximity

These little junctions, that is, nuclear pore – mitochondrial associations, have been fascinating to me.  I have noticed and photographed (whether ideally fixed, or in focus, or in this species or that cell type, just as many as i can) to try someday to figure out what tasks they are carrying out. The obvious of course, providing energy, maybe for nucleo-cytoplasmic transport, but maybe too for nuclear rotation, as we all know happens from observing those old time lapse videos of tissue culture cells with mitochondria dancing close to the nucleus and the nucleus spinning  — ha ha – new question, to nuclei on the northern hemisphere rotate the same way as nuclei cultured in the southern hemisphere?) and also for nuclear shaping, but importantly, do they have something to do with chromosome territories? That is, something more than just an indirect influence like shape or transporting molecules.  Might they participate in the transport of ions through the outer pore areas as well as the core.  Might they influence assembly and repositioning of nuclear pores, making and or breaking them.

This particular nuclear pore-mitochondrial association is not the best micrograph in the world by a long shot, but it is from a heterozygous animal conditional ko of  Gclc in the liver (wc/ii) so has some increase in oxidative stress.

The original micrograph is on the left taken at 9500x, neg 17535 block 73458 anm# 505 wt hepatocyte.  filaments (wiggly lines) going up toward the mitochondria (top shaded grey) are prominent , the nuclear basket is not prominent, and something looks to be a pattern underneath the pore (black oval) that would likely be some tangential portion of the nuclear membrane (not hazarding a guess as to whether outer or inner.


Nuclear pores from Gclc ko and wt mice

Apoptosis seems to cause a real reduction in the chromatin exclusion zone of hepatocytes.  The area is very small on either side of the nuclear pores. This would have to be functional but whether it relates to something changing about the nuclear basket portion of the nuclear pore complex, or about the chromatin, or about some other proteins that are part of the exclusion zone is up for debate. These pores are from nuclei which appear to be undergoing apoptosis, showing lots of peripheral chromatin, a little different in texture than regular condensed chromatin and an euchromatin space which is a little denser and more populated with interchromatin granule clusters than a non-apoptotic cell would be. These cells would be from livers of animals either never rescued or removed from NAC. Pore complexes are about 120nm in their widest dimension and there is another (taken from a n of 5 random pore and their exclusion zone images) another 55nm of exclusion on either side. This is in agreement with a larger selection of chromatin exclusion zones measured in both Gclc ko and 14CoS ko mice… previous posts on this site, which was 48nm and 50.9nm.

Similar small chromatin exclusion zones are found in cells in liver in eminent apoptosis in the 14CoS null mice when they are NOT rescued with NTBC.

electron microscopy nuclear pores chromatin exclusion zones in apoptosis

More nuclear pores, just randomly collected various cell types

More nuclear pores, just randomly collected various cell types. The criterion that I used was simply the presence of vertical filaments (either part of the nuclear pore basket on the nuclear side or the filaments in the cytoplasm on that side. These come from lung alveolar type II cells, from hepatocytes, and from CoS14 ko mice, rescued and non-rescued, and probably a couple from Gclc conditional KO mice. These are just to give the limit of what effects random sectioning through a block of tissue can do to a round or discoid object. These pores are cut perpendicular (side views), and chromatin is always on top, cytoplasm is always below.

Nuclear pore measurements: pore to pore, chromatin exclusion zone, granule to granule

Three measurements taken in a series. Pore to pore, pore to to edge of chromatin (which i found is called the chromatin exclusion zone, so am sticking with that since it clearly is an active event, and may vary with cell type and cell activity) and inter-@19 nm “beads” that are seen as the organized chromatin just adjacent to the nuclear pore (the first thing seen after the chromatin exclusion zone).  This micrograph is from the same images as a previous post, which is 16027_65718_14Cos_ko 24hr no NTBC measurements.-2a. n=5,  pore to pore=316nm+104nm; n=15, chromatin exclusion zone, 50.9+23nm; n=5, 19nm to 10nm chromatin granule, 54nm+17.7nm