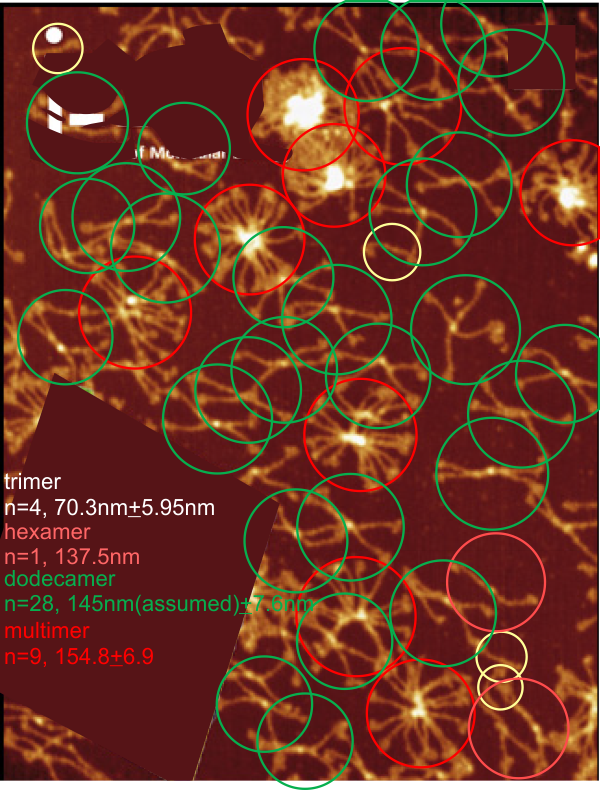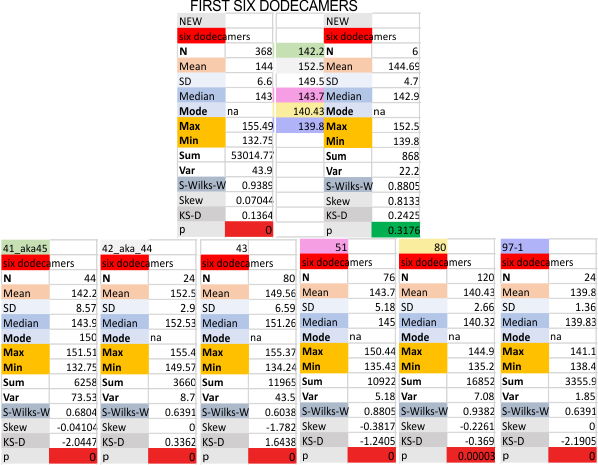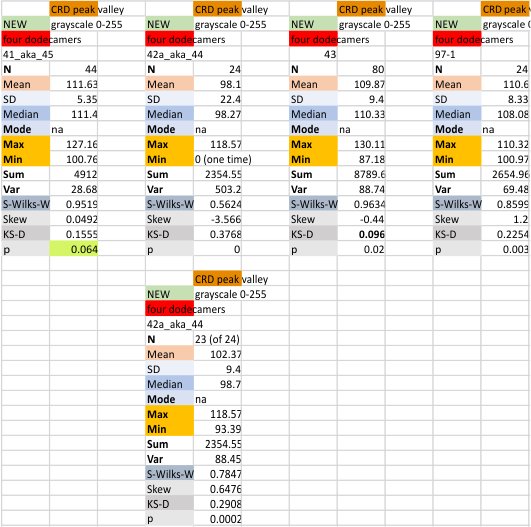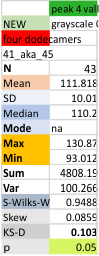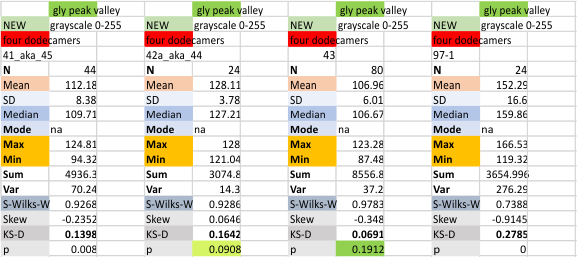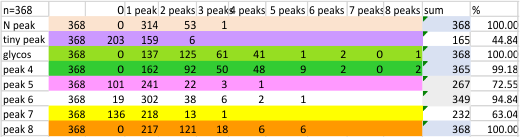
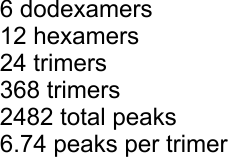
Previous signal and image processing programs have shown that the mean number of peaks per trimer is about 8…. this has the N peak counted twice, since the N peak in AFM images only infrequently shows (but sometimes it is very apparent, just not consistently apparent) that there is a decrease in grayscale in the center of the N peak (thus called a junction, as it is the joining somehow of the N term domains of two trimers in the case of the hexamer, and four trimers in the case of the dodecamer). The number was 15 peaks across a hexamer.
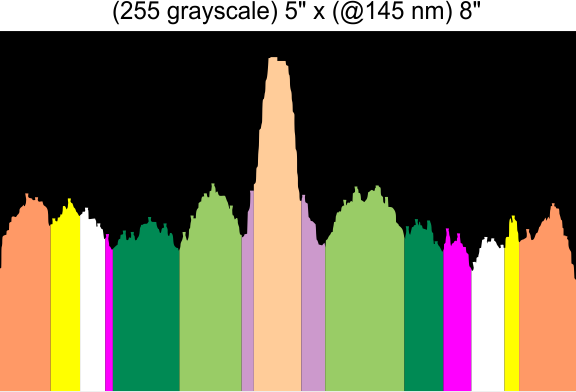
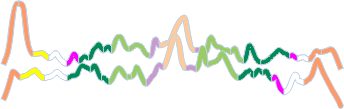
Using that 15 as a guidline, and the signal processing peak finding apps mentioned many times in this blog, i have sorted it into 8 general appearance – type peaks.. That is not individual peaks in particular, but the ups and downs of the valleys and peaks in harmony. N term junction peak is present in 100% of the grayscale plots (a given), next, the glycosylation peak (peak 3) which is a prominent peak laterally on both sides of the N term peak in a hexamer, is also present 100% of the time. What I call peak 4 is a rolling but still prominent peak lateral to the glycosylation peaks, and is often wider than the other peaks but also has a higher number of “peak-divisions” than any other set of peaks. Peak 5 is usually thin, not prominent, and appears just 72% of the time, depending upon how “smoothed” the signal processing app is. Peak 6, is present frequently, measured above 94% of the time, is low and not too broad and it is isolated as a separate peak to justify the division number of 15 peaks that signal processing has defined. Peak 7 which is pretty clearly the neck region, not present all the time because the CRD domain just flops over and covers it often, and it is quite close and thin, beside the CRD peak. Peak 8 is the CRD peak(s) domain and can presents with up to 5 smaller peaks within what is pretty surely the elevated grayscale values at either end of the hexamer.
Without question, the type of signal processing influences the way peaks are counted, and the settings within those programs. I will at some point pick out my favorite signal processing programs and use them to recreate the dataset. CUrrently i like the PeakValleyDetectionTemplate.xlsx (Tom O’Haver), and Octave’s AFPPxy. These still are not as good as my own peak detection … ha ha… which i call “educated machine vision”