Category Archives: surfactant proteins A and D
Four dodecamers: N term junction peak valleys
The peak height has been found, the valleys on the side of each peak progressing to the center (inward sid of the peak, coming from the CRD toward the center, thus the right hand side of the left part of the image, and the left hand valley side coming from the right CRD meeting in the center where the N term peak is.
This means that each trimer valley value is taken from the side directed toward the N term peak As recorded for widths and peak heights, the valley height is measure in all the separate trimers (N=172)(N=4).

Four dodecamers: Peaks 6 and 7 height and CRD height – grayscale 0-255
Plots of SP-D trimers (as hexamers) with the N term peak becoming a whole peak (not just a half peak as the molecule would suggest happens..this done for ease of calculating thus each shows 15 peaks per hexamer (an odd number) or 8 peaks per trimer. Using many plots ( grayscale plots obtained in ImageJ), peak heights are being determined for each peak set, and these data are for peak 6, as yet unnamed but present at least 90% of the time in this dataset — 100% of the time in the plots for two molecules, 95% in one molecule, and 82.5% in another). Using just the summaries for the four dodecamers (without the missing values) the peak height for peak 6 is 115+/2.6 Screen prints from excel are below.


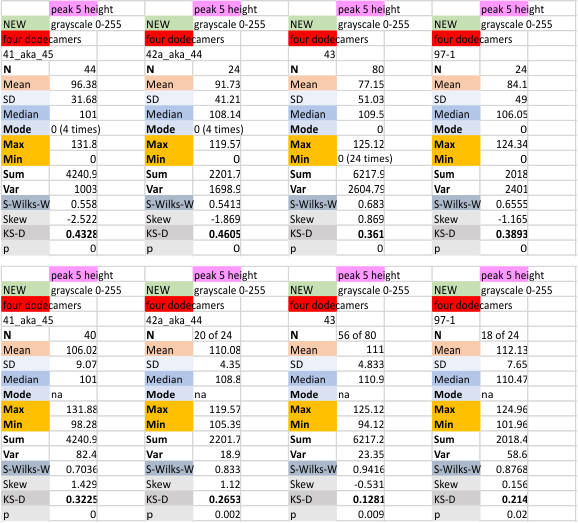
Four dodecamers of SP-D: height of peak 5 (on a grayscale of 0 255)
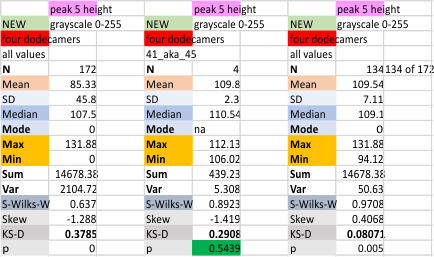 Peak 5 is a very consistent low thin peak that follows after the broad peak adjacent to the glycosylation peak. See previous blog entries for position and width of this peak (which I have always (at least 99% of the time) given the color code of bright pink. First set of numbers calculates parameters WITH the missing values as 0. second (far right) set of parameters is calculated from all plots in this dataset but WITHOUT the missing values as 0, they are eliminated. Plots below the top image are those two variations (with (top row) and without (bottom row) missing values), for the four individual dodecamers studied so far. The best data comes from using the N of four, mean peak 5 height from each of the dodecamers. Measurements are grayscale 0-255 on the Y axis.
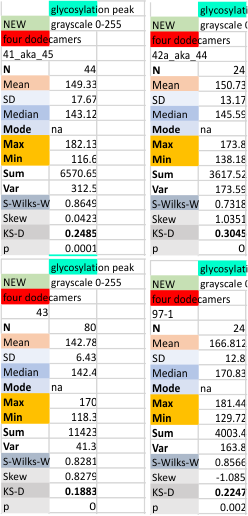
Four dodecamers: Peak height for the glycosylation peak (peak 3)
This is a known peak in the SP-D dodecamer (actually measured here as peak height in each trimer, on the left as the total of the grayscale plot values, on the right as the mean of each of the separate trimers in each of four dodecamers). 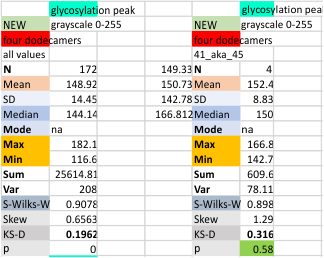
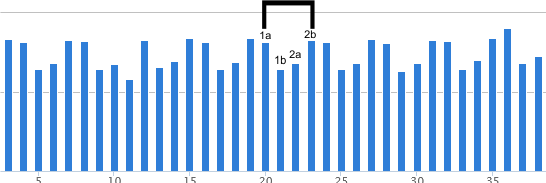
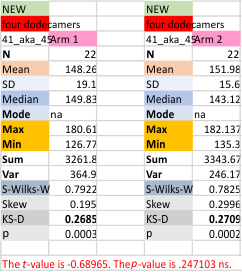
Four dodecamers: trimer pattern in glycosylation peak (peak 3) height
Does anyone see a pattern here, in the glycosylation peak height, arm 1 and arm 2. It is very clear that the different image analysis filters dont mean a whole lot, when compared to the actual molecule, the relative heights of each of the peaks along a length of a trimer (hexamer = 2 trimers). This made me examine the trimer glycosylation peaks of this SP-D dodecamer separately, comparing peak heights. Repeating pattern for each arm is clear. Since each hexamer is plotted as trimer 1a and 1b, and 2a and 2b, the fact that the difference in the hexamer glycosylation peak heights is not significantly different using a t-test, even though this pattern occurs, I am going to continue to use the data each trimeric arm separately.
It is important for me to say that I think thee are differences in the glycosylation peak height that relate to the “number” of arms in the trimer that actually have a glycan attached — could it vary, one, two or three, which would then result in a different grayscale value for peak height (and valley).
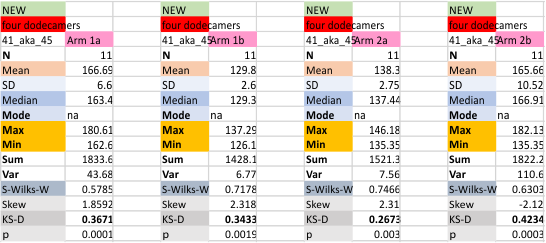
 The mean for each glycosylation peak in each of the four trimers of the dodecamer, and each of the image and signal processing apps (n was 11 for each trimer)
 t-test comparing the four trimers follow.
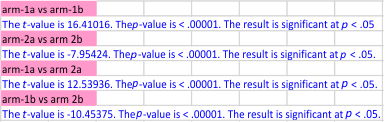
Values for the glycosylation peak grayscale height for each hexamer of the single dodecamer (that is arm 1a and 1b, and arm2a and 2b) in a t-test were not significantly different).
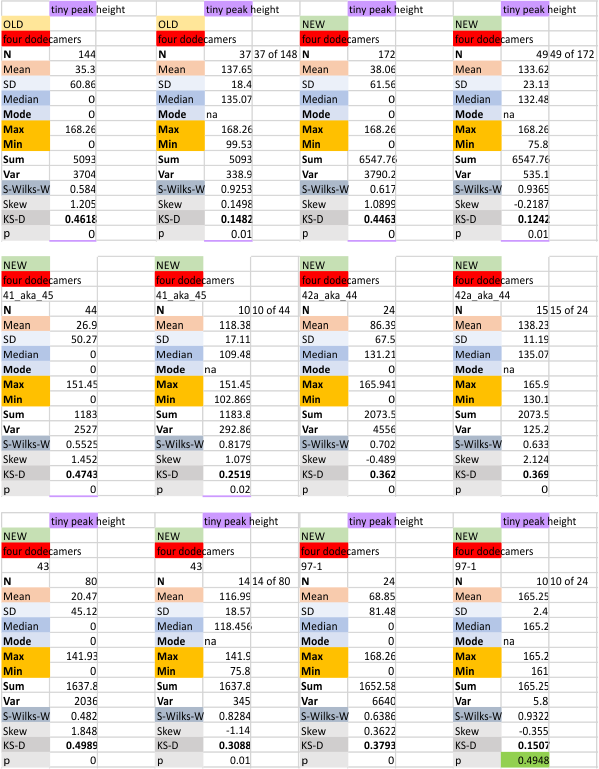
Four dodecamers: tiny peak (peak 2) height
I know this is going to sound like I dont care about traditional statistical methods, but in this case I makes NO sense to me at all to include many 0 in a mean as a missing value when the results puts the peak height below the background. SO, while i have calculated that missing value in on the old database, and the new database (and the only one i will continue to get peak heights from) and shown them both here. I have taken just the values from instances where this tiny peak (peak 2 – adjacent to the N term peak) occurs. Those means are presented in the bottom screen print from excel. I also will stop reporting about the normal distribution (see medium green cells), which can happen when data of missing values are excluded) otherwise that makes no sense to me either.

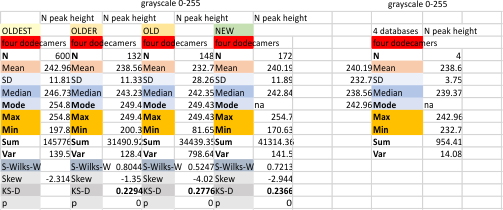
Four dodecamers of SP-D, four databases, mean grayscale peak height for the N term peak
Four dodecamers of SP-D, four databases, mean grayscale peak height for the N term peak is about 238.6 +/ 3.75 nm. The grayscale given in the plots made for the images in ImageJ, and then subjected to a variety of image and signal processing algorithms. The column indicated with the title NEW, is a smaller dataset taken from four dodecamers (8 trimers, put plotted as trimers) so every n= is a value for a trimer. The N term peak is plotted in its completeness for each trimer, not divided in half. Dividing the N term in half didn’t really fit the images, as many cases there is a small peak, or valley in the center of the N trimer, and that complicates where it should be divided into two or four. So the peak of the N trimer below is the tallest point (not necessarily in the center) of the N peak.
Bottom line for me (maybe not for you) but for me is that the value of 238.6 is just fine for creating one point on the “training plot” to use for supervised learning in AI to apply to the remaining SP-D images I have obtained from published literature.
The four dodecamers used in this training plot are among the better images of SP-D (from Arroyo et al).
Four dodecamers: comparing mean peak widths +/ SD with a single image
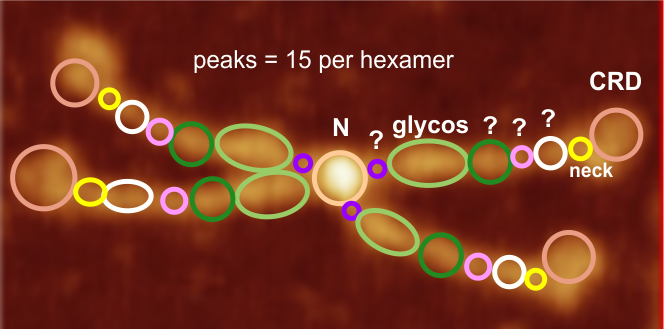
This is going to be a hard sell to someone who has not spent dozens of hours looking at SP-D images. The mean peak width (+/SD) are in relative proportion placed just over a randomly selected image of a SP-D dodecamer. The color bar shows the mean peak widths for the 15 peaks (the number 15 was obtained by signal processing (peak finding programs), image processing (represented here are two or three image filters) and 4 dodecamers, hundreds of grayscale plots and width measurements). There is consensus, but it is not immediately intuitive. Colored bars with SD on either side represent peak width in nm (relative). Count from N term to CRD on top bar, CRD to N term on bottom bar. Glycosylation peak is mid-green color. Each peak is identified on bottom image with text and a circle and color to match the actual peak widths shown on the top image.
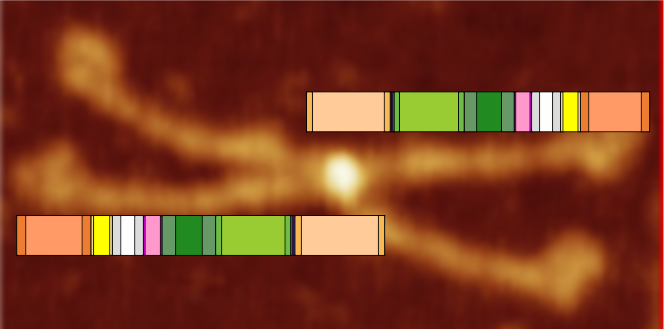 My sorting of those 15 signal processing identified peaks using circles and colors to match image above. Four peaks (per trimer, 8 peaks per hexamer) as yet unidentified are marked with a questionmark.
 peak 1, N=19.9nm+/1.42nm
peak 2, tiny=0.9nm+/0.38nm
peak 3, glycos=16.7nm+/1.32nm
peak 4=11.98nm+/3.7nm
peak 5=4.18nm+/0.41nm
peak 6=6.89nm+/1.94nm
peak 7, neck=4.74nm+/0.56nm
peak 8, CRD=16.56nm+/2.04nm
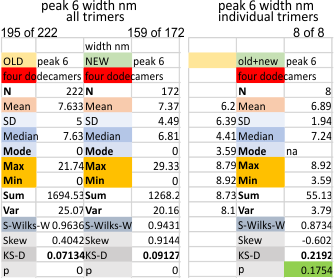
Four dodecamers: peak 6 width (nm)
The trial dataset for peak width I think is pretty much finished. There is not a lot more that
I can do using signal processing peak finding apps. The data are pretty consistent from old to new values, and different programs, each analyzed as a single large dataset, or as individual dodecamers. (N of four dodecamers (8 hexamers) only at this point, but hundreds of grayscale plots to determine peak width, using the basic peak count per hexamer from previous plots. This peak is something around 7 nm wide, and is consistently seen (354 times out of 392 plots of trimers – about 90%). It is consistently a low peak and fairly broad. Old dataset (from a few months ago) and New recent dataset, with more equitable numbers of plots from each of four dodecamers. Nothing really changed, which is nice.