I think the short answer is that the width of peaks do not change, but the height of peaks (brightness, not unexpectedly) changes, and since contrast and brightness are so variable, then a way to create an internal control is necessary. This could probably be done by setting a mean (calculated using many plots) for the background and for the peaks of the Ntermini. The latter could be set at 250, and the background would be best set around 50 (which is where I find that the images generally sort to.
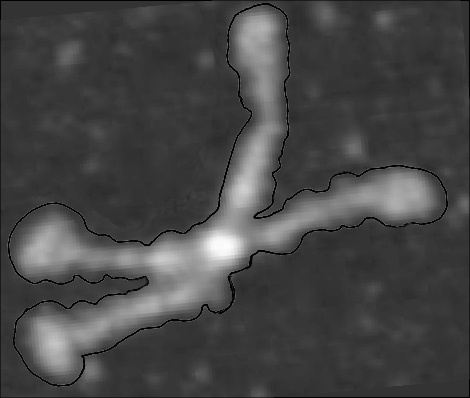
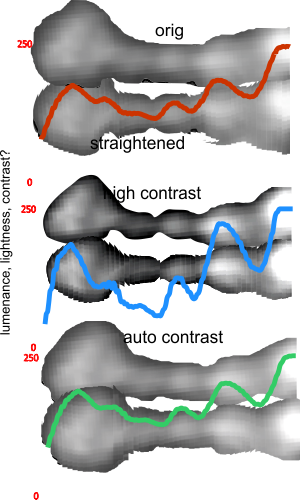
Looking at the AFM images of this particular (very nice) image from Arroyo et al, I made a test of whether changing the contrast changed the number of plots visible in the LUT tables (the stretch from the center of the Nterminus to the CRD – that is one arm of the dodecamer. The actual dodecamer is pictures above, and the preparation of the single trimeric arm used with the different contrast applications appear below. The whole image (top) is as is from Arroyo et al, but just converted to rgb with no saturation and exported as a tif for ImageJ. Middle image has the original opened in photoshop and contrast was enhanced manually without losing light and dark areas (subjectively). Lowest pair of images is using the original image and autobalance in photoshop. Each of the dissected portions (one trimeric arm, all Ntermini are on the right hand side) was cut into 1nm slices, then those slices were centered horizontally (to compensate for the bend in the arms of SP-D. Almost all multimers of SP-D and many single trimers do show an arc (which i calculated a long time ago thus need to be straightened and realigned to the concensus magnification (in nm). This is actually the same image as posted in the previous update.
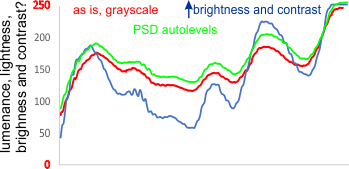
The LUT plots for the contrast enhanced (2) and the original image (1) are compared. In truth, while the peaks and valleys in the high contrast image are more separate than uncontrast enhanced, or autocontrast adjusted, they all show plots very close in alignment and shape. (See a composite with the red plot (gray scale as is), green plot (autocontrast adjusted in photoshop) and blue, with very high contrast. Peak heights change considerably, width of peaks did not, neither did relative size of neighboring peaks. This is particularly important in the collagen-like domain where three peaks along that stretch of amino acids occur. There is a problematic fourth peak, lateral to the Nterminus, where the coiled coil neck is, and while i have not measured it, the angle of deviation in the globular units should match the angle in RCSB models of the neck and CRD regions.