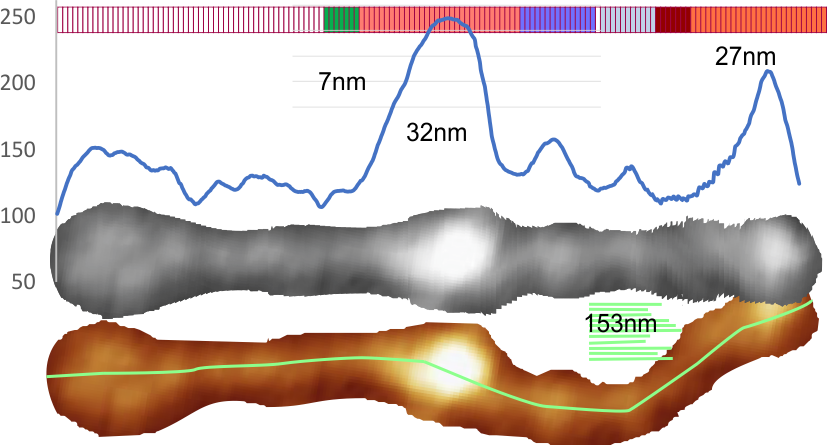
This is a pretty nice image from Arroyo et al, and I wanted to compare the width of the LUT peaks and number of peaks to see whether the bright spot on a single arm of this dodecamer was in the right position of they proposed glycosylation site. It is not conclusive because on the left arm… clearly peaks are disrupted, on the right portion of the arm (and right portion of the plot) there are still two large and one very small peak between the Ntermini peak and the right hand CRD peak. The Ntermini peak looks a wider than usual and measures (using their bar marker) at about 32nm wide…. wider than other measurements.
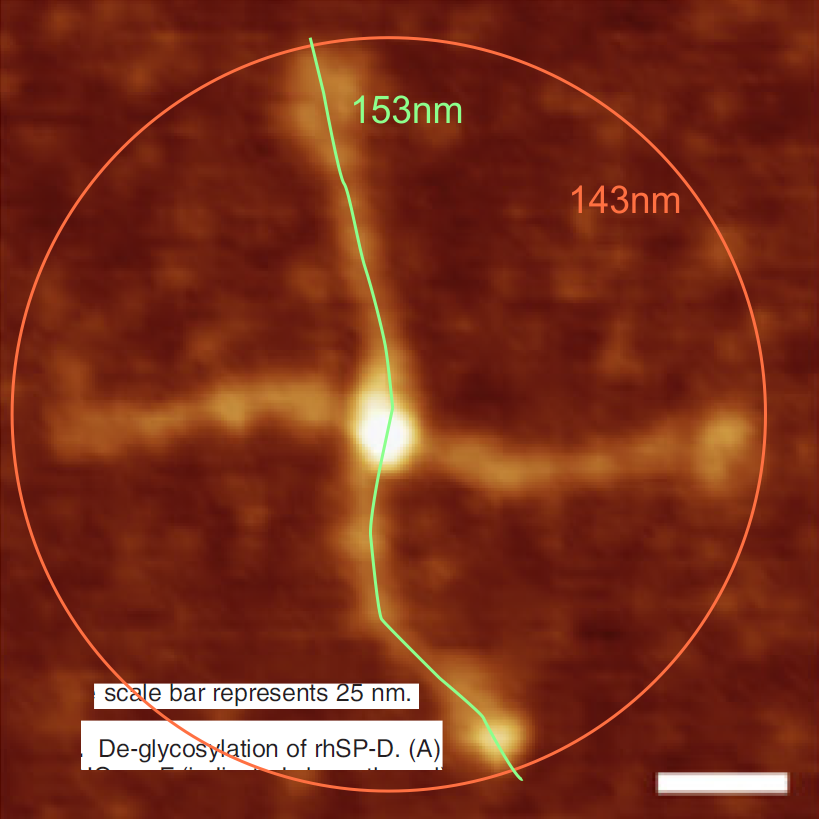
Original image of theirs with a line with 10 nodes to determine actual length, and a diameter (which came out slightly smaller than the line method. Image was cut into 153 vertical slices, ungrouped, centered horizontally, converted to greyscale, exported as RGB tif and plotted using ImageJ. Plot (at 153nm width) is above the images.