Using Cobalt RID I have searched for anything similar to human surfactant protein D. I am sure many others have done similar searches. What I gleaned from this is that having atomic force microscopy on one (any) of those species with an extended collagen like domain will show whether the three (possibly four) brightness peaks along the collagen like domain are functional (duh) and relevant to the formation multimers. That said I will list those species (common name and species name) below — which will take some time.
Monthly Archives: October 2019
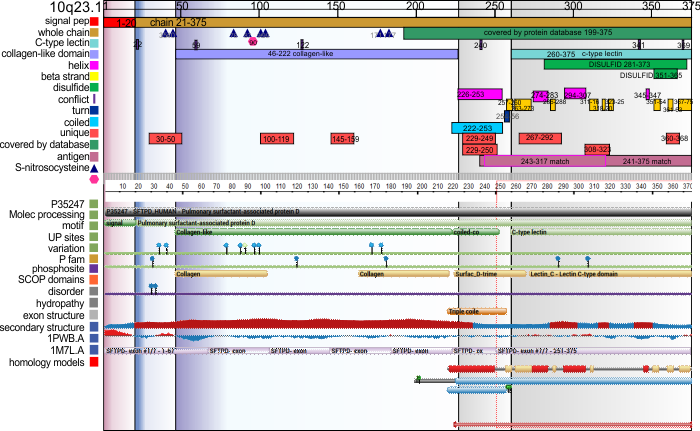
Graphic comparison of Uniprot and RCSB’s analysis of SP-D
These two databases don’t quite agree. FOr me (a non protein chemist) it makes it a little difficult to work with. 🙂
Conserved sequences in SP-D
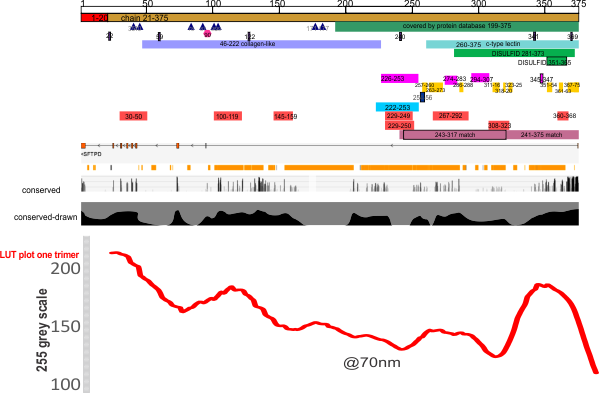
When i looked at RCSB for SP-D and noticed the trends in the conserved regions of the SP-D protein I noticed that the highly conserved regions were an iteration of the “highs,” “bright spots,” aka “peaks” in LUT tables. It made me stop and wonder whether the protein configuration was really that closely aligned to the peaks in brightness seen in the AFM images (right down to the concensus curve (red line) that I have generated for a group of 6 – 8 hexamers) and what is also seen in the many LUT plots for AFM images not included in this concensus curve, and even some of the rotary shadowed images of SP-D. Coincidence?
Looking at images of SP-D from other species and mutated SP-D and other collectins with the straight collagen-like domain and neck and CRD domains will tell. At any rate, I thought it was interesting enough to take the time to create and match the curves to the data.
Upper part of this graphic is UniProt, conserved line in the middle is from RCSB, the black line is my vector line drawing of the conserved sequences, and the red line is a composit from actual LUT plots for SP-D, with the Nterminus on the left, collagen-like domain towards the center and the neck and CRD on the right. The LUT scale (1-255) is the Y axis on the right of the SP-D LUT plot.
Bottom image is the whole UniProtKB-P35247 graph

Surfactant proteins in a clara cell granule – is there a pattern
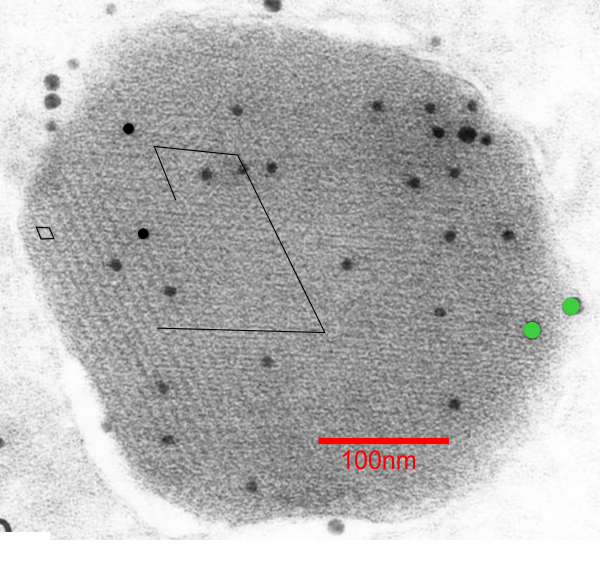
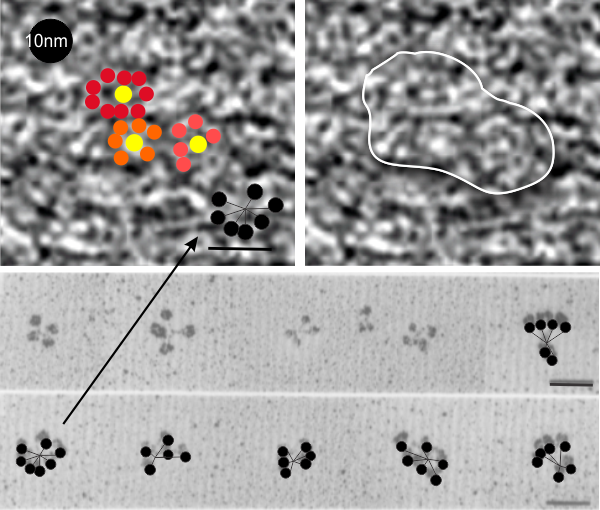
When I saw this picture (ref here) and saw the angles, rows and hexagonal array of bright and dark spots in this immunohistochemical image (SP-A they say is 10nm probe and SP-D is a 15nm probe and the SP-A is really the only one within the granule, the SP-D is on the peripehery and only two grains are present) I got curious to see whether there was any similarity in size of these “flowers” “bouquets” in a highly organized grid pattern and what I saw in the type II alveolar cells (posted dozens of times before now). Magnifications don’t really add up, but that is nothing new, since most magnification markers are way off what is actually reported for size.
I think it is fair to say the probe size is pretty reliable (LOL). I put this image (with my colored (mostly 6 branched (presumably trimers of SP-A) flowers in color just to show them off, and marked two of the 60o patterns in a moderately enlarged image (sized with the colored flowers) against the backdrop of the clara cell granule.
The image of shadowed SP-A is one i have referenced many times, and the 50nm marker for those molecules would appear to be too large for the approx 13-20nm colored flower hexagonal figures within the clara cell granule however, the shape really fits – who to believe, perhaps totally irrelevant (but i think not). Images below, their granule. black circles=10nm, green circles (SP-D size)=15nm. Bottom picture, my depiction of the six sided SP-A in an hexagonal array, some CRD indicated by colored circles, N termini are central in the flowers. (someone elses’ shadowed image of SP-A 18-mers which sadly are not the right size..but i bet there is an explanation. White line in figure to right shows where in the cropped enlarged image i put the petals to the bouquet flower. 18-mers of SP-A I have drawn in lines and circles over their original images of shadowed SP-A molecules.
This is a visual representation, just of what I see as possible correlations in structure, sequences, and AFM characteristics of a single trimer of surfactant protein D. REF
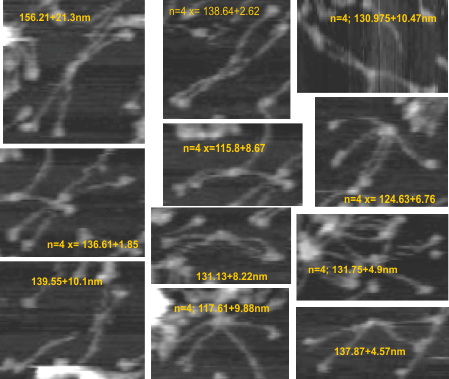
11 SP-D dodecamer measurements from AFM
11 dodecamers were analyzed (some really hard to define in and amongst the various parts and pieces of SP-D in the multiple-molecule AFM image that is provided in a manuscript by Heartshorn et al on SP-D. Just 11, and four measurements using three different techniques were made to compare methods ultimately to get a gold standard for SP-D size from which to do brightness analyses of the collagen like segment of the molecules (where total length needs to be controlled (adjusted) to determine whether there are common peak heights in at least 4 consistent blips SP-D, two of which have been noted, the largest blip being called by Arryoy et al a glycosylation site.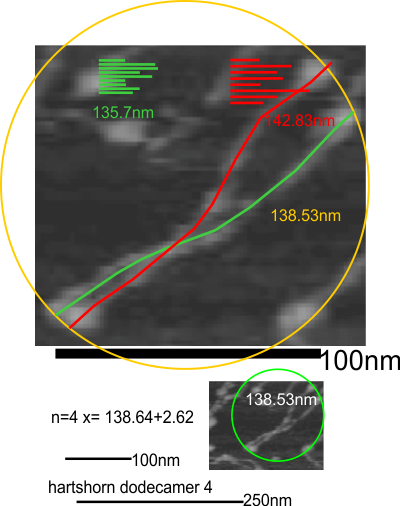
So here is a measure : diameter from original small image, diameters from images enlarged (remember that the diameter must lightly touch the outside of the CRD in three of the four CRD domains – one (two: one done on the original micrograph which is about 4 times smaller than each enlargement where diameter is also measured). Hartschorn et al’s bar marker for nm and peak height is used with all their image. Secondly, vector line measurements of each of the hexameric arms (alleged linking of two trimers into a hexamer at the N termini in the center of the molecule (with the measure of the hexamer going from one CRD through the joined Ntermini and exiting half the dodecamer with arms.
n=42;132.489+14.6
Diameters and vector line segments for measuring SP-D dodecamer size
Hartshorn et al’s AFM black and white image of groups of SP-D multimers has both height and nm axes marked. Six dodecamers were measured from that published original micrograph: in one method they were cropped and measured enlarged using the diameter technique-with the perimeter of the circle touching at least three CRD of the four arms (or half of the multimers). This method is quick. And secondly by measuring each arm individually with a vector line (in which each segment of that line was measured individually by the process of breaking apart the line at “nodes”, rotating each line segments to horizontal and converting the lines from inches to nm using the scale of original and cropped images which were equally manipulated.
These 2 methods produced different results. The diameter method produced a dodecamer value of 131nm+/-11nm. This value is not too far from that posted for just the diameter measurements from these same images: n=23 x=130.3nm +/-7.8. It is however quite a bit smaller than from the cover image of Arroyo et al where no micron measurement bar was present on that image and thus SP-D multimers were were measured only “relative” to the mean of other Arroyo images where a micron bar was given.
(n=14 (two arms each); 144.49nm +/- 7.02nm).
In my humble opinion, these image probably wont give much info in terms of collagen-like domain brightness peaks. The resolution is just pretty low but they should be just fine for overall dimensions.
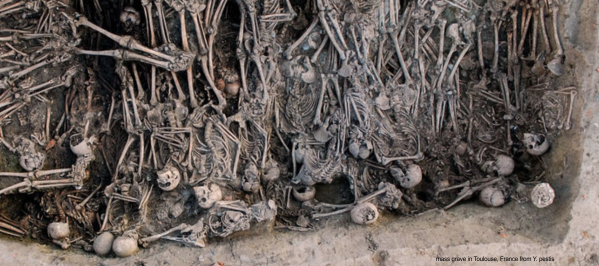
Hauntingly beautiful?
It will seem odd to most but i find this image as beautiful as any abstract art I have seen, and so deeply moving. We are nothing more than iterations, repeating stanzas; cut and paste; carbon copies — all of us. See original image here.
One image, SP-D sizes by diameter
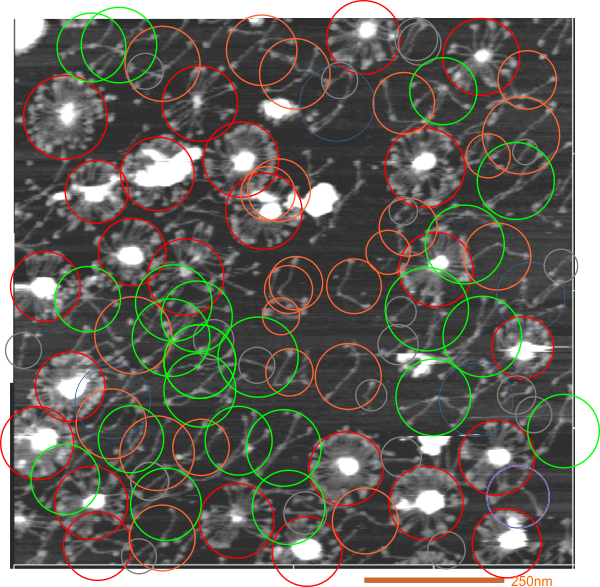
Just trying to get a common size for SP-D multimers and dodecamers. These are data using molecule diameter, a single AFM image from Hartshorn et al.
You can see that these images are just slightly smaller than the means found for Arroyo et al. Whether prep, or differences in the actual SP-D are responsible is a question.
Some species just cannot be determined others are covered up, and so it is an estimate, i understand that. For trimers smallest diameter was used, for hexamers as well, for all other multimers at least half the CRD had to be on the rim of the circle to determine the diameter.